 Interactive Voice Response Diagrams
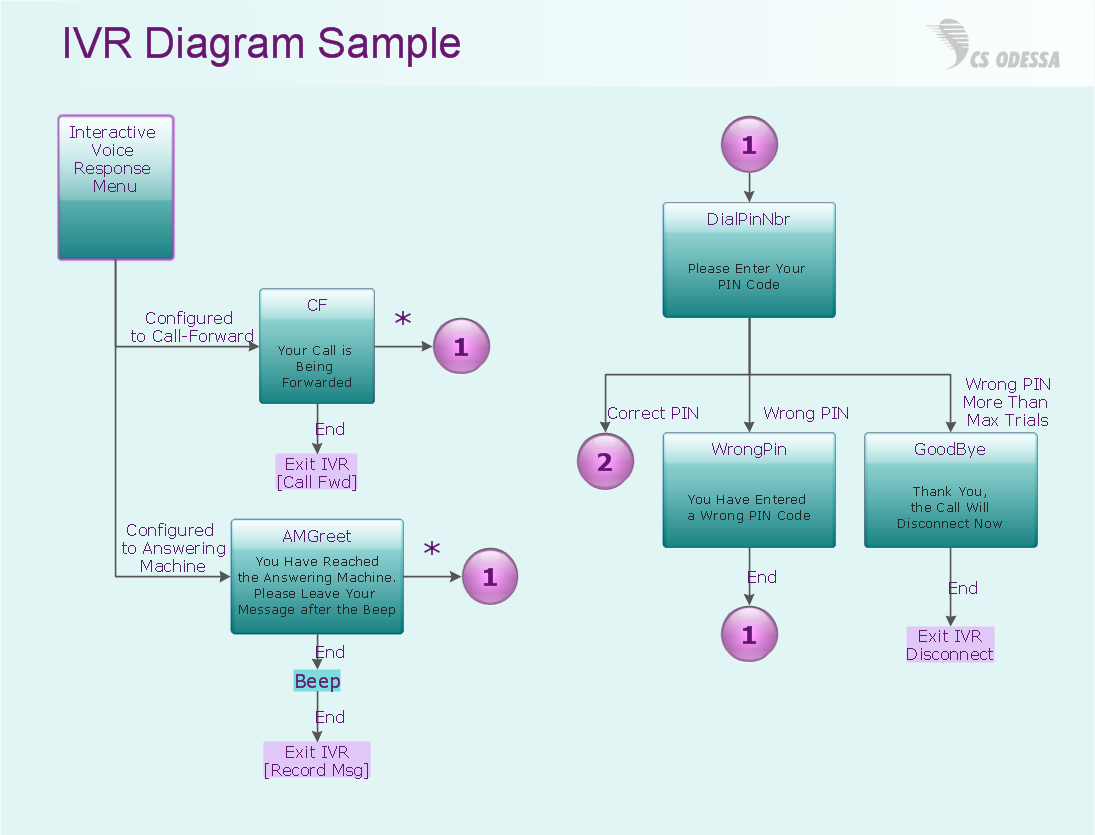
Interactive Voice Response Diagrams solution extends ConceptDraw DIAGRAM software with samples, templates and libraries of ready-to-use vector stencils that help create Interactive Voice Response (IVR) diagrams illustrating in details a work of interactive voice response system, the IVR system’s logical and physical structure, Voice-over-Internet Protocol (VoIP) diagrams, and Action VoIP diagrams with representing voice actions on them, to visualize how the computers interact with callers through voice recognition and dual-tone multi-frequency signaling (DTMF) keypad inputs.
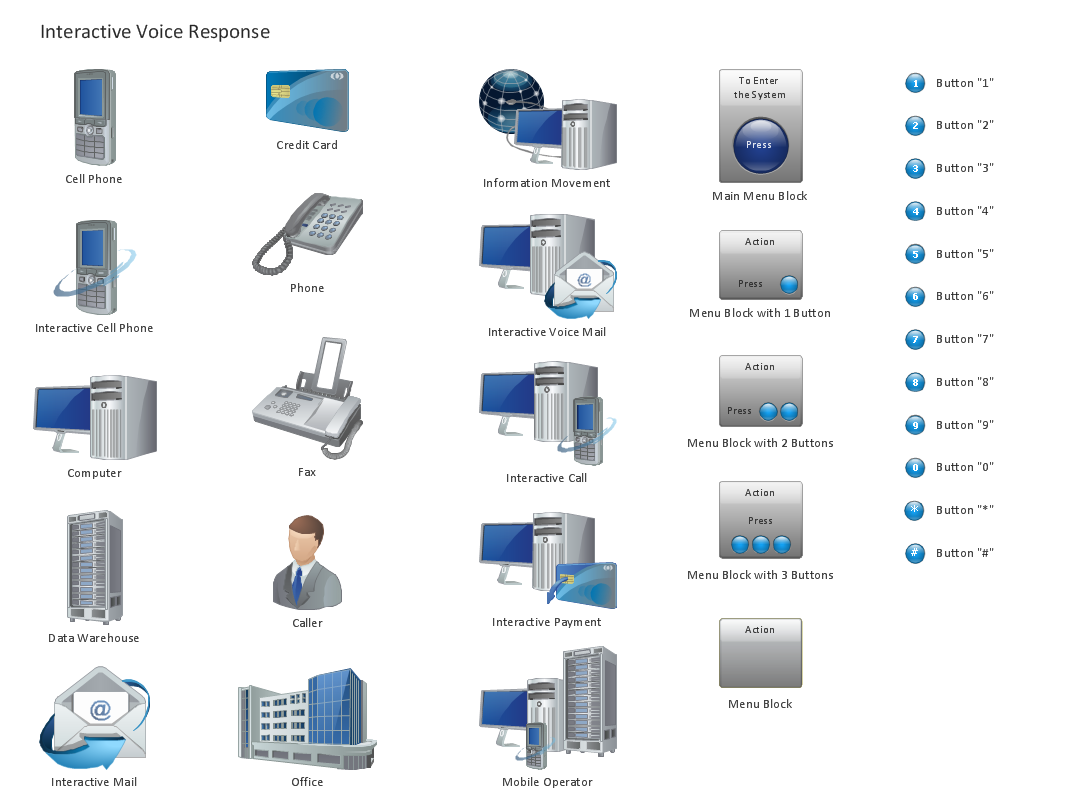
Design Element: IVR for Network Diagrams
ConceptDraw DIAGRAM is perfect for software designers and software developers who need to draw IVR Network Diagrams.
HelpDesk
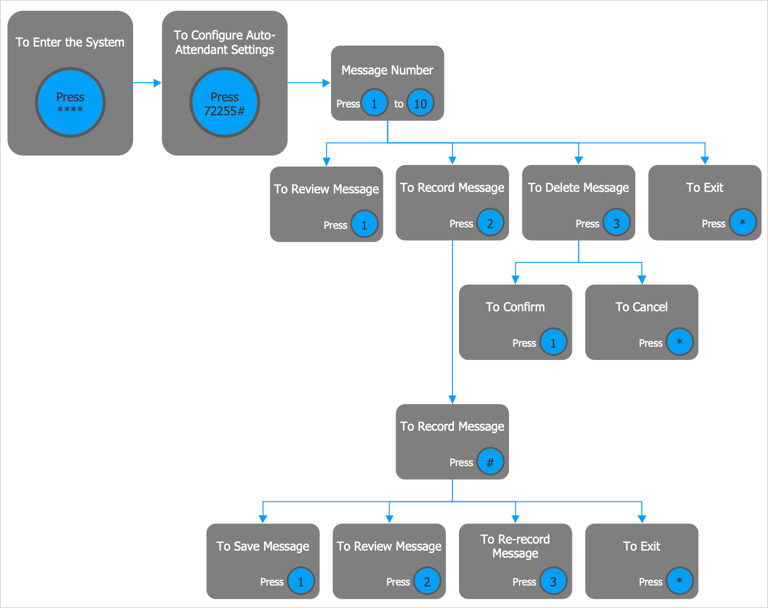
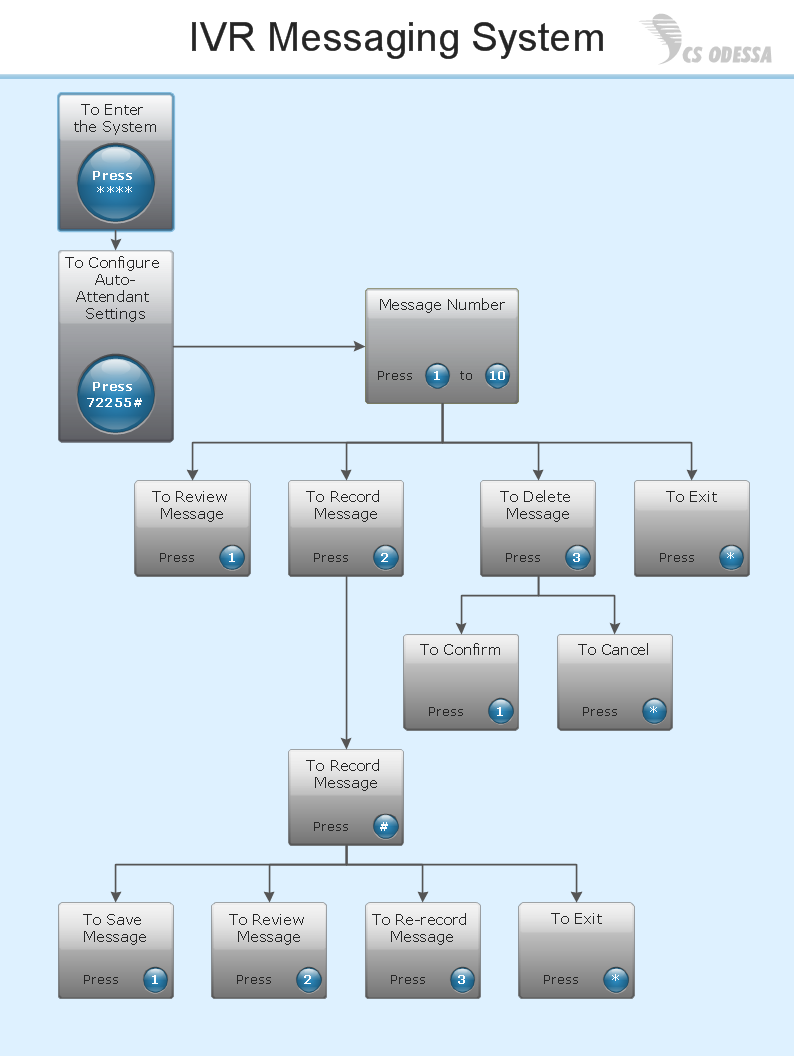
How to Create an Interactive Voice Response (IVR) Diagram
Interactive Voice Response (IVR) Diagram is used to create and conduct the Interactive Voice Response systems for call-centers and voice mail services. IVR diagrams intended to visualize the logical and physical structure of Interactive voice response systems. ConceptDraw solution for Interactive Voice Response (IVR) Diagram allows you to create and communicate the Interactive Voice Response diagram of any complexity. Interactive Voice Response (IVR) System is a telecommunication technology that enables a computer to automatically process voice and touch phone signals. IVR systems allows users to interact through a computer with various service systems, available by telephone. The objective of IVR system is to reduce customer service costs by delivering self service to customers and guiding them to the information that they look for.Network Configuration
Network configuration is a method of connecting computers among themselves, also known as a network topology. Three main types of connections are the most commonly used: Bus, Ring, Star. Before network design and purchase of necessary network equipment, it is necessary to consider all details, carefully examine the conditions, in which a given network will be exploited and certainly to draw a diagram of future network with all its parameters. The scheme can be designed manually on a paper, but it is better to apply a special software, such as ConceptDraw DIAGRAM diagramming and vector drawing software supplied with Computer Network Diagrams solution. Use of predesigned network icons from the libraries of Computer Network Diagrams solution, also built-in templates, samples and examples, is helpful to develop and represent network architecture, topology and design, and to make with ease professional-looking Network configuration diagrams and Network topology diagrams for LANs and WANs, to design Wired and Wireless computer communication networks, Mobile and Vehicle nets, IVR systems, etc.
Interactive Voice Response Network Diagram
ConceptDraw solution Computer and Networks provides Interactive Voice Response samples, templates and library of 35 vector stencils for drawing the IVR network diagrams. Use ConceptDraw DIAGRAM diagramming and vector drawing software enhanced with solution Computer and Networks to visualize the logical and physical structure of IVR systems for inbound and outbound call centers and voice mail systems.
Data Flow Diagram (DFD)
A Data Flow Diagram (DFD) illustrates the flow of data through an information system, visualizes how the information is handled in terms of inputs and outputs, how the data enter to system and leave it. It is effective to use a Data Flow Diagram for creation the system's overview, to show the system's scope and boundaries. There are two different types of notations for DFDs: Yourdon-Coad and Gane-Sarson, which differ in visual representations for processes, data flow, data stores, external entities, etc. Thus, for example the processes are depicted as circles in Yourdon-Coad notation and as rounded squares in Gane-Sarson notation. Gane-Sarson notation is usually used for visualization information systems and Yourdon-Coad - for system analysis and design. The Data Flow Diagrams solution included to Software Development area of ConceptDraw Solution Park offers a lot of DFD templates, samples and examples, libraries of vector stencils for construction without efforts the DFDs according to both Gane-Sarson and Yourdon-Coad notations.MS Visio Look a Like Diagrams
No need for any special drawing skills to create professional looking diagrams outside of your knowledge base. ConceptDraw DIAGRAM takes care of the technical details, allowing you to focus on your job, not the drawing. ConceptDraw DIAGRAM delivers full-functioned alternative to MS Visio. ConceptDraw DIAGRAM supports import of Visio files. ConceptDraw DIAGRAM supports flowcharting, swimlane, orgchart, project chart, mind map, decision tree, cause and effect, charts and graphs, and many other diagram types.Database Design
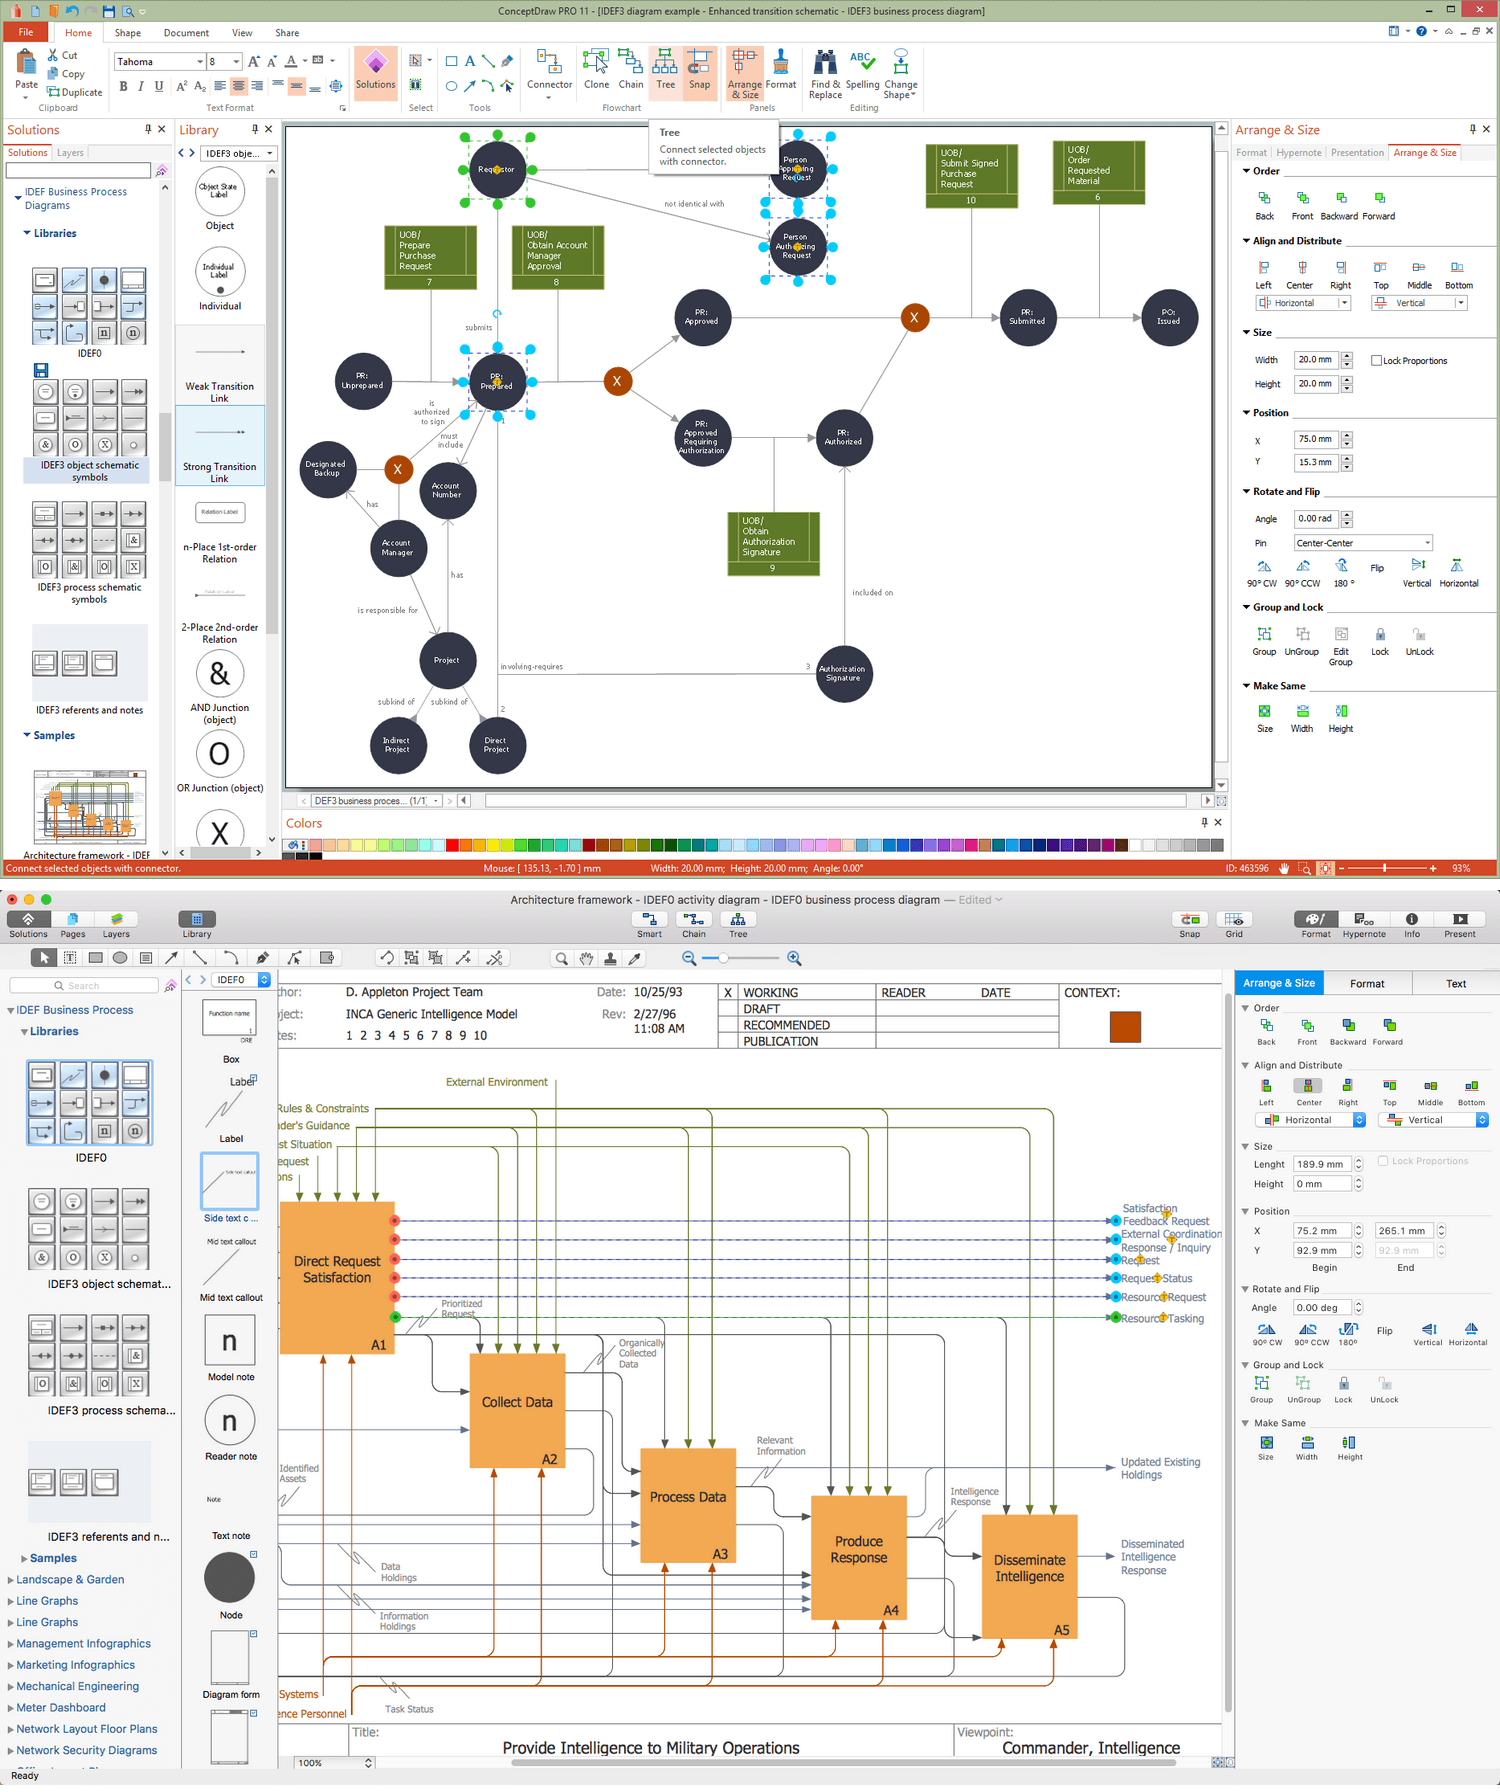
ConceptDraw DIAGRAM extended with IDEF Business Process Diagrams solution from the Business Processes area of ConceptDraw Solution Park is an ideal software for effective database design and drawing IDEF diagrams visually representing all steps of database design process.UML Package Diagram. Design Elements
UML Package Diagram illustrates the functionality of a software system. ConceptDraw has 393 vector stencils in the 13 libraries that helps you to start using software for designing your own UML Diagrams. You can use the appropriate stencils of UML notation from UML Package library.Illustrate the Computer Network of a Building
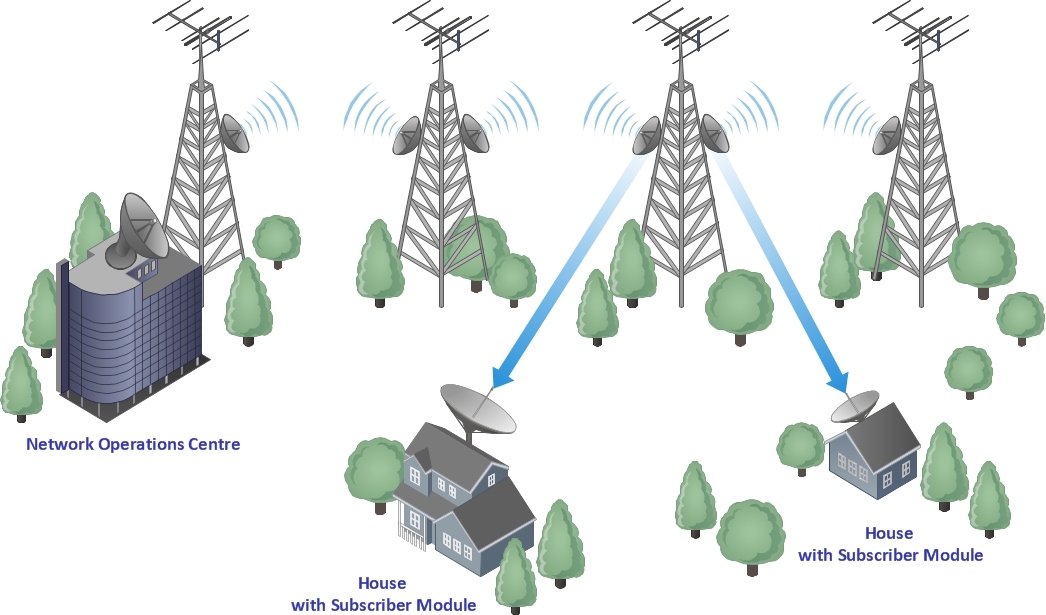
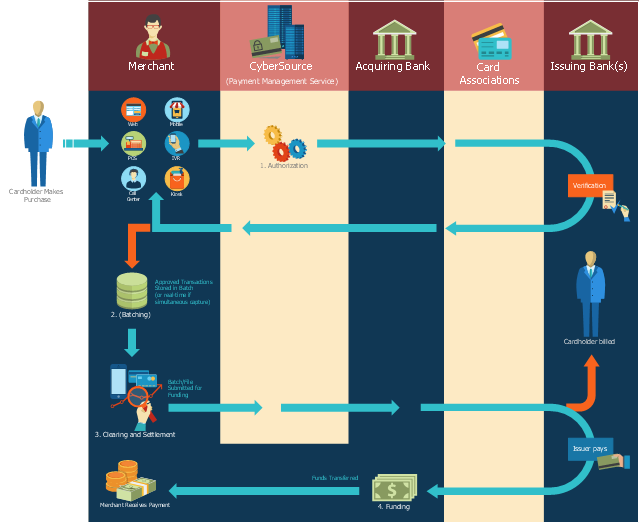
With best content of the Wireless Network solution that includes more than 10 building pre-designed objects network engineers can illustrate the computer network of a building.This payment process flowchart example was created on the base of the diagram of payment process using Global Payment Processing Services from the U.S. Securities and Exchange Commission website.
"Global Payment Processing Services. CyberSource Advanced enables merchants to accept payments made by all major credit and debit cards including American Express®, Discover®, Diners Club International®, JCB, MasterCard®, and Visa® cards. Our customers can also accept payment by corporate procurement cards, electronic checks, PayPal® Express Checkout, and the Bill Me Later® service. Merchants that have business models based on subscriptions can utilize the CyberSource recurring billing service with automated account updating services. For merchants selling internationally, we support direct debit, and bank transfers, as well as regional card brands such as Carte Bleue, Carta Si, Dankort, Laser, Solo, and Visa Electron. We provide these services for online, call center, kiosk, integrated voice response (“IVR”), and IP-enabled point of sale (“POS”) transactions."
[www.sec.gov/ Archives/ edgar/ data/ 934280/ 000119312510042764/ d10k.htm]
The flowchart example "Global Payment Solutions" was created using the ConceptDraw PRO diagramming and vector drawing software extended with the Sales Flowcharts solution from the Marketing area of ConceptDraw Solution Park.
Software development with ConceptDraw DIAGRAM
Modern software development requires creation of large amount of graphic documentation, these are the diagrams describing the work of applications in various notations and cuts, also GUI design and documentation on project management. ConceptDraw DIAGRAM technical and business graphics application possesses powerful tools for software development and designing technical documentation for object-oriented projects. Solutions included to the Software Development area of ConceptDraw Solution Park provide the specialists with possibility easily and quickly create graphic documentation. They deliver effective help in drawing thanks to the included package of templates, samples, examples, and libraries with numerous ready-to-use vector objects that allow easily design class hierarchies, object hierarchies, visual object-oriented designs, flowcharts, GUI designs, database designs, visualize the data with use of the most popular notations, including the UML and Booch notations, easy manage the development projects, automate projection and development.- Flow Chart For Ivr
- Ivr Flow Chart Visio
- Interactive Voice Response Diagrams | Store reporting flowchart ...
- Interactive Voice Response Diagrams | How to Create an Interactive ...
- Store reporting flowchart | Interactive Voice Response Diagrams ...
- IVR services | Process Flowchart | Total Quality Management with ...
- IVR services | Store reporting flowchart | IVR balance recharge ...
- Example ENUM | Store reporting flowchart | How VoIP works | Ivr
- Store reporting flowchart | IVR Network Diagram | Interactive Voice ...
- Interactive Voice Response Diagrams | IVR Network Diagram | Store ...
- Interactive Voice Response Diagrams | How VoIP works | Basic ...
- Process Flowchart | IVR services | Flow chart Example. Warehouse ...
- Design elements - IVR blocks | Store reporting flowchart | How to ...
- IVR Network Diagram | IVR | Store reporting flowchart | Interact Call ...
- Database Design | Store reporting flowchart | How to Create an ...
- Store reporting flowchart | Example ENUM | Active Directory ...
- Workflow Diagrams | IVR services | Types of Flowcharts | Weather ...
- IVR services | IVR balance recharge | Store reporting flowchart | Ivr ...
- IVR balance recharge | IVR services | Process Flowchart | Flight ...
- Interactive Voice Response Diagrams
