The Best Flowchart Software Available
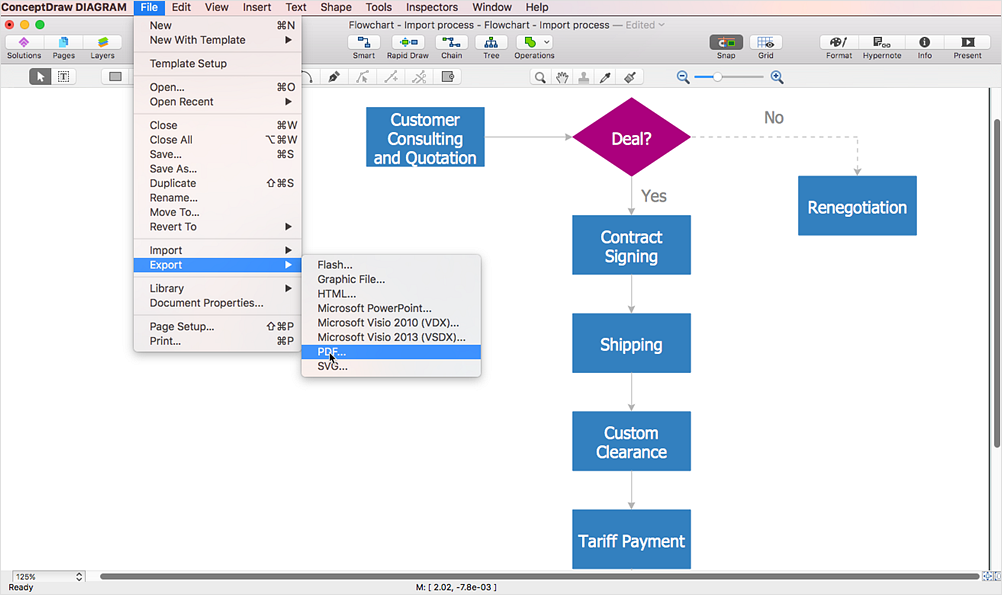
ConceptDraw gives the ability to draw Flowchart documents. Flowcharts solutionis a powerful tool that extends ConceptDraw application for drawing business flowcharts. ConceptDraw DIAGRAM ector diagramming and business graphics software enhanced with with templates, green and interactive flowchart makers, samples and stencil libraries from ConceptDraw Solution Park which all focused to help with drawing flowcharts, block diagrams, bar charts, histograms, pie charts, divided bar diagrams, line graphs, area charts, scatter plots, circular arrows diagrams, Venn diagrams, bubble diagrams, concept maps, and others.
Flowchart Software
Flowchart is a simple diagram, map or graphical schematic representation the sequence of actions within a process. It is ideal for displaying how a process currently flows or can function ideally. The Flowcharts let define the steps and boundaries of a process, uncover problems or miscommunications. The Flowcharts are widely used in education, software development, business, economics, thanks to their visuality they are ideal for presentations, reports, for using on conferences to help the audience comprehend the content better, or easy find flaws in a process flow diagrams. ConceptDraw DIAGRAM is professional flowcharts software and feature-rich flowchart maker, which supports Mac OS X and Windows. It contains at ConceptDraw Solution Park a rich set of stencils and professional flowchart symbols for design. It lets create simply professional-looking Flowcharts based on thousand free flowchart templates, colored symbols and examples. ConceptDraw DIAGRAM is a 3 times cheaper alternative to MS Visio available for both Mac and PC. It’s is another full featured business and technical diagramming application that can easily take care of Visio files within OS X. Another bonus with ConceptDraw DIAGRAM – it's cross-platform. You can work on a document in both OS X and Windows, skipping Visio entirely.
Flow Chart Online
Flow Chart is a great visualization tool for the flow of a process, algorithm or procedure with a lot of benefits. It is convenient to use a powerful software for creating flow charts. Now we have the best flow chart maker online design software - ConceptDraw DIAGRAM enhanced with Flowcharts Solution from the "Diagrams" Area of ConceptDraw Solution Park.HelpDesk
Flowchart Software Free Download
Making flowchart is an easiest way to depict any typical process. Any complex process, consisting from standard components can be displayed as a Flowchart. ConceptDraw DIAGRAM is proved to be a simple and easy tool for creating flowcharts. It does not require the skills of a professional designer. Making flowchart to map any process you will see the ways of its optimization and improvement. Flowchart software is here and you can download it for free.Create Flow Chart on Mac
A Flowchart is a commonly used type of chart that describes an algorithm, process or workflow. It applies the boxes of various kinds to represent the steps and connects them with arrows showing their order. The Flowcharts help to understand the processes, visualize the process steps, and effectively find the flaws and bottlenecks. They are widely used in various fields for analyzing, documenting, designing, and managing simple and complex processes and programs, for representing process operations and problems' solution models. There are many types of Flowcharts, such as Cross-Functional Flowcharts, Data Flow Diagrams, Swimlane Flowcharts, Workflow Diagrams, Business Process Diagrams, Process Flowcharts, etc. ConceptDraw DIAGRAM is a powerful diagram software used to create Flow chart on Mac and Windows without efforts. The Flowcharts solution from Diagrams area of ConceptDraw Solution Park and ConceptDraw Rapid Draw functionality are greatly effective tools for designing various types of Flowcharts for business processes.Data Flow Diagram Software
Data Flow Diagrams (DFDs) are successfully used when studying the business processes or systems that involve the transfer of data. They are a visual way to represent the data processing, to model and visualize the flow of data through a computer system and functional requirements for a designed system. They are the good business modeling tool to describe the business events and interactions, the physical systems involving the storage and transfer of data. ConceptDraw DIAGRAM supplied with Data Flow Diagrams solution from Software Development area of ConceptDraw Solution Park is a modern and powerful data flow diagram software. This solution offers large set of predesigned DFD vector objects, grouped to three libraries: Data Flow Diagrams, Gane-Sarson Notation, and Yourdon and Coad Notation. All they and also collection of DFD samples and built-in templates make a good base for ConceptDraw DIAGRAM users, providing them all conditions for easy creation the Data Flow Diagrams and Data Flow Models of any complexity.Flowchart Programming Project. Flowchart Examples
Create you own flow charts of process-driven software applications using the ConceptDraw DIAGRAM diagramming and vector drawing software extended with the Cross-Functional Flowcharts solution from the Business Processes area of ConceptDraw Solution Park. The programming project flow chart example shows the logical process of execution.Workflow Application
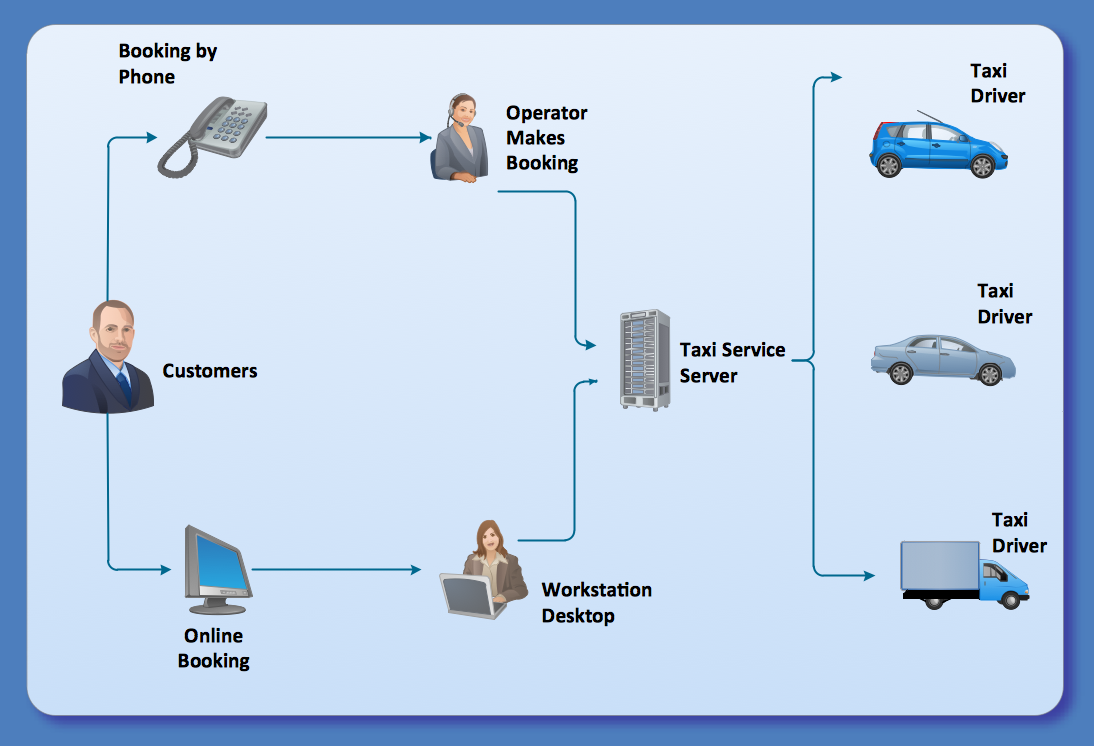
ConceptDraw DIAGRAM application is perfect for creating workflow diagrams. This application contains specific features and technologies designed to draw diagrams faster, such as RapidDraw and Arrows10. ConceptDraw DIAGRAM software extended with the Workflow Diagrams solution gives you a flexible tool to draw any kind of workflow.The Circular Flow Diagram
ConceptDraw DIAGRAM diagramming and vector drawing software extended with Target and Circular Diagrams solution from the Marketing area of ConceptDraw Solution Park is perfect for the Circular Flow Diagram creating.- Flowchart Software Free Download
- Top 5 Android Flow Chart Apps | Flowchart Software Free Download ...
- Top 5 Android Flow Chart Apps | Flowchart Program Mac | Process ...
- Flowchart Software | Top 5 Android Flow Chart Apps | How To ...
- Top 5 Android Flow Chart Apps | Android User Interface | How To ...
- Top 5 Android Flow Chart Apps | Workflow Application | Cubetto ...
- Process Flowchart | Top 5 Android Flow Chart Apps | Flow Chart ...
- Flowchart Software | Flowchart Software Free Download | Process ...
- Business Processes | Process Flowchart | How to Design an ...
- Top 5 Android Flow Chart Apps | How to Design an Interface Mock ...


