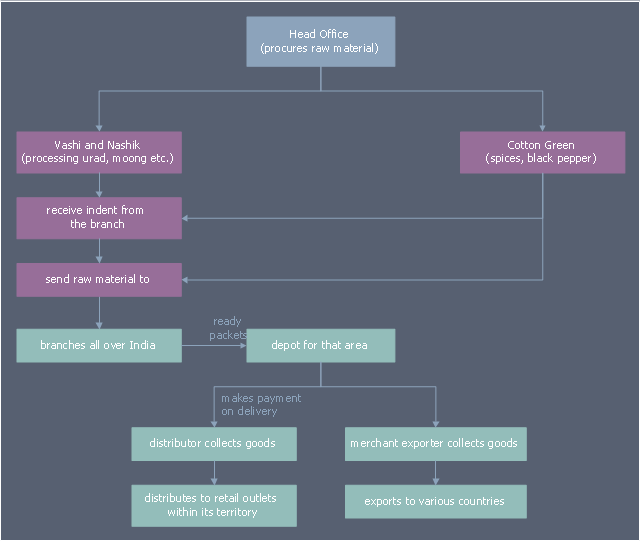
This business process flowchart example was redesigned from the Wikimedia Commons file: SMGULP-distribution-flowchart.png.
[commons.wikimedia.org/ wiki/ File:SMGULP-distribution-flowchart.png]
"Shri Mahila Griha Udyog Lijjat Papad, popularly known as Lijjat, is an Indian women's cooperative involved in manufacturing of various fast moving consumer goods." [Shri Mahila Griha Udyog Lijjat Papad. Wikipedia]
The business process map example "Distribution flowchart example" was drawn using the ConceptDraw PRO diagramming and business graphics software extended with the Business Process Mapping solution from the Business Processes area of ConceptDraw Solution Park.
Flow Chart Symbols
The Flowcharts are incredibly useful and popular tool used in science, business, software development, analytics, engineering, marketing, manufacturing, administration, architecture, government, politics, and many other fields thanks to a variety of existing types of flowcharts. A Flowchart is a visual graphical representation of the process, algorithm, or the set of steps taken for problem's solution. Widely used for designing, visualizing and documenting simple and complex processes and programs, they effectively help to understand the process and to find easier the flaws if they are. Each flowchart type supposes the use of its own set of notations for drawing corresponding diagram, which includes the symbols of process, decision, data, document, data base, termination, initiation processes, processing loops, conditions, etc. It is easily design a Flowchart using the special professional flowchart maker - ConceptDraw PRO diagram software with numerous predesigned flow chart symbols grouped in libraries of Flowcharts solution from ConceptDraw Solution Park.
 Logistics Flow Charts
Logistics Flow Charts solution extends ConceptDraw PRO v11 functionality with opportunities of powerful logistics management software. It provides large collection of predesigned vector logistic symbols, pictograms, objects and clipart to help you design with pleasure Logistics flow chart, Logistics process flow diagram, Inventory flow chart, Warehouse flowchart, Warehouse management flow chart, Inventory control flowchart, or any other Logistics diagram. Use this solution for logistics planning, to reflect logistics activities and processes of an enterprise or firm, to depict the company's supply chains, to demonstrate the ways of enhancing the economic stability on the market, to realize logistics reforms and effective products' promotion.
Flowchart Marketing Process. Flowchart Examples
This sample shows the Flowchart that displays the layout and work flow of the cloud marketing platform. This diagram has a style of the marketing brochure. This style displays the central product that is related to the other issues. Using the ready-to-use predesigned objects, samples and templates from the Flowcharts Solution for ConceptDraw PRO you can create your own professional looking Flowchart Diagrams quick and easy.Flow chart Example. Warehouse Flowchart
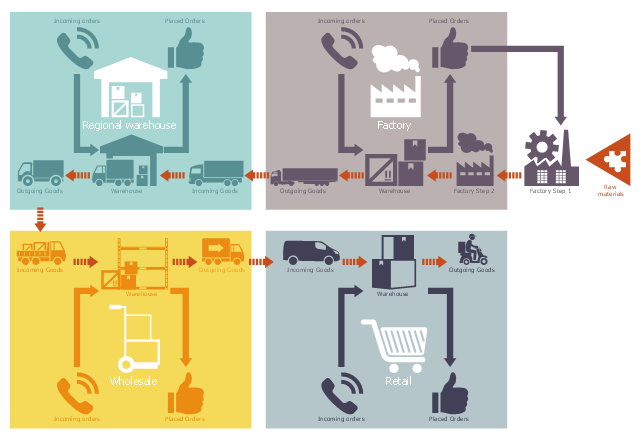
Warehouse Flowcharts are various diagrams that describe the warehousing and inventory management processes on the warehouses. Typical purposes of Warehouse Flowcharts are evaluating warehouse performance, measuring efficiency of customer service and organizational performance. This type of Workflow diagrams can be used for identifying any disconnection between business activities and business objectives. They are effectively used by warehouse-related people and organizations, manufacturers, wholesalers, exporters, importers, transporters, and others. Standard Warehousing process flow diagram and standard Workflow diagram are used for process identification for further evaluating effectiveness and profitability of overall business process. Use the ConceptDraw PRO vector graphic software extended with Flowcharts solution to design your own professional-looking Workflow diagrams and Flowcharts of any types, including the Warehouse flowchart, Process flow diagrams which depict in details all steps of Warehouse packages flow. Microsoft Visio, designed for Windows users, can’t be opened directly on Mac. But fortunately, there are several Visio alternatives for Mac which will help Mac users to work Visio files. With ConceptDraw PRO, you may open, edit and save files in Visio format.
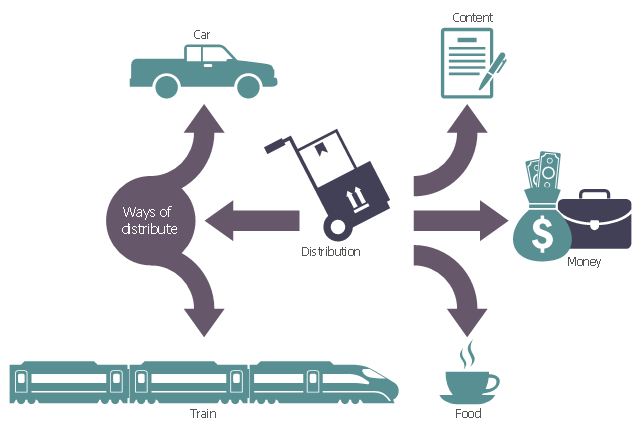
This logistic flow chart sample illustrates the distribution as economics term.
It was designed on the base of the Wikimedia Commons file: 46v1 New-Sheet.jpg.
[commons.wikimedia.org/ wiki/ File:46v1_ New-Sheet.jpg]
"Distribution in economics refers to the way total output, income, or wealth is distributed among individuals or among the factors of production (such as labour, land, and capital). In general theory and the national income and product accounts, each unit of output corresponds to a unit of income. One use of national accounts is for classifying factor incomes and measuring their respective shares, as in National Income. But, where focus is on income of persons or households, adjustments to the national accounts or other data sources are frequently used. Here, interest is often on the fraction of income going to the top (or bottom) x percent of households, the next y percent, and so forth (say in quintiles), and on the factors that might affect them (globalization, tax policy, technology, etc.)." [Distribution (economics). Wikipedia]
The logistic flowchart example "Distribution mind map" was created using ConceptDraw PRO diagramming and vector drawing software extended with the Logistics Flow Charts solution from the Business Processes area of ConceptDraw Solution Park.
This logistic flow chart sample shows a board design for the beer distribution game.
It was designed on the base of the Wikimedia Commons file: Beer Distribution Game Board.JPG. [commons.wikimedia.org/ wiki/ File:Beer_ Distribution_ Game_ Board.JPG]
This file is licensed under the Creative Commons Attribution-Share Alike 3.0 Unported license. [creativecommons.org/ licenses/ by-sa/ 3.0/ deed.en]
"The beer distribution game (also known as the beer game) is an experiential learning business simulation game created by a group of professors at MIT Sloan School of Management in early 1960s to demonstrate a number of key principles of supply chain management. The game is played by teams of at least four players, often in heated competition, and takes at least one hour to complete. A debriefing session of roughly equivalent length typically follows to review the results of each team and discuss the lessons involved.
The purpose of the game is to understand the distribution side dynamics of a multi-echelon supply chain used to distribute a single item, in this case, cases of beer." [Beer distribution game. Wikipedia]
The logistic flowchart example "Beer distribution game" was created using ConceptDraw PRO diagramming and vector drawing software extended with the Logistics Flow Charts solution from the Business Processes area of ConceptDraw Solution Park.
 Accounting Flowcharts
Accounting Flowcharts solution extends ConceptDraw PRO software with templates, samples and library of vector stencils for drawing the accounting flow charts.
Flow Chart Symbols
ConceptDraw PRO software extended with Flowcharts Solution from the "Diagrams" Area is a powerful software that will help you design the flowcharts for any business and technical processes, and software algorithms thanks to the predesigned flow chart symbols. Flowcharts solution offers 2 libraries with large collection of vector flow chart symbols: Flowchart Library, Flowcharts Rapid Draw Library that you can use to create your flowcharts quick and easy. Flowchart Solution is number of diagraming stencils including special set of flow chart symbols such as: terminator, process, decision which indicates a decision points between two or more paths in a flowchart, symbol of delay. Major symbols includes symbol of data, document or multiple documents, subroutine, preparation for processing of documents. Also includes symbols: display, manual input, manual loop, loop limit, stored data,connectors and suming junctions, sort and merge operations, symbols of database and internal storFlowchart Definition
Flowchart definition - A Flowchart is a diagram that graphically represents the structure of the system, the flow of steps in a process, algorithm, or the sequence of steps and decisions for execution a process or solution a problem. For depiction the steps there are used specific shapes and graphic symbols which are linked by lines and directional arrows. The main standard shapes are rectangle or box, rounded box, diamond, circle. A Flowchart is a convenient way to observe the follow the process from beginning to end, it lets improve the work of process, highlight the key elements and detach not essential or even excessive steps. The Flowcharts can represent different levels of detail: High-Level Flowchart, Detailed Flowchart, and Deployment or Matrix Flowchart. They are incredibly useful for programmers when developing the programs of any complexity and on any high level language. Create your own Flowcharts using the ConceptDraw PRO diagramming and vector drawing software and powerful tools of Flowcharts solution from "Diagrams" area.- Distribution Process Flow Chart
- Sales Distribution Flow Chart
- Simple Products Marketing And Distribution Process Flow Chart
- A Complete Flowchart Of Distribution Design Of Any Shopping Mall
- Flow Chart Of Distribution
- Frequency Distribution Flow Chart
- Flow chart Example. Warehouse Flowchart | Basic Flowchart ...
- Distribution Flow Chart Template
- Product Distribution Flow Chart
- Sales And Distribution Flow Chart


