TQM Diagram Example
The Total Quality Management Diagram solution helps you and your organization visualize business and industrial processes. Create Total Quality Management diagrams for business process with ConceptDraw software.Process Flow Chart Symbols
Process Flow Chart is a visual diagram which shows the processes and relationships between the major components in a system, and uses for this the special process flow chart symbols: special shapes to represent different types of actions and process steps, lines and arrows to represent relationships and sequence of steps. It often named process flow diagram, it use colored flowchart symbols. It is incredibly convenient to use the ConceptDraw DIAGRAM software extended with Flowcharts Solution from the "Diagrams" Area of ConceptDraw Solution Park for designing professional looking Process Flow Charts.Flow Chart Template
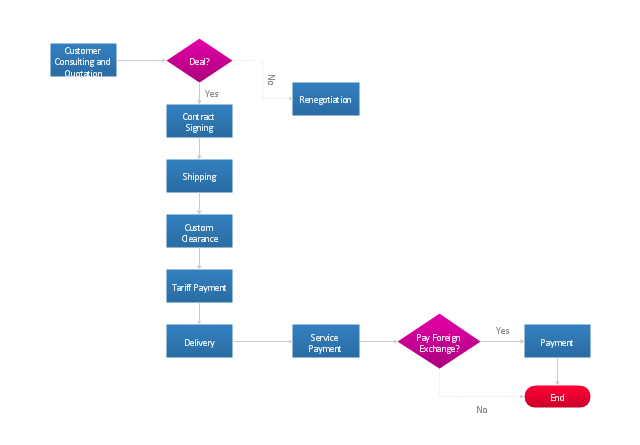
Templates are very useful and convenient tool for fast and easy drawing various diagrams, charts, and also flowcharts. It is the excellent news that ConceptDraw DIAGRAM diagramming and vector drawing software extended with Flowcharts Solution from the "Diagrams" Area offers wide collection of various predesigned flowchart samples and flow chart template."An import is a good brought into a jurisdiction, especially across a national border, from an external source. The purchaser of the exotic good is called an importer. An import in the receiving country is an export from the sending country. Importation and exportation are the defining financial transactions of international trade.
In international trade, the importation and exportation of goods are limited by import quotas and mandates from the customs authority. The importing and exporting jurisdictions may impose a tariff (tax) on the goods. In addition, the importation and exportation of goods are subject to trade agreements between the importing and exporting jurisdictions." [Import. Wikipedia]
The flow chart example "Import process" was created using the ConceptDraw PRO diagramming and vector drawing software extended with the Flowcharts solution from the area "What is a Diagram" of ConceptDraw Solution Park.
"An import is a good brought into a jurisdiction, especially across a national border, from an external source. The purchaser of the exotic good is called an importer. An import in the receiving country is an export from the sending country. Importation and exportation are the defining financial transactions of international trade.
In international trade, the importation and exportation of goods are limited by import quotas and mandates from the customs authority. The importing and exporting jurisdictions may impose a tariff (tax) on the goods. In addition, the importation and exportation of goods are subject to trade agreements between the importing and exporting jurisdictions." [Import. Wikipedia]
The flow chart example "Import process" was created using the ConceptDraw PRO diagramming and vector drawing software extended with the Flowcharts solution from the area "What is a Diagram" of ConceptDraw Solution Park.
Basic Diagramming. Flowchart Software
Create flowcharts, flow charts, and more with ConceptDraw flowchart software.
Audit Flowchart Symbols
The audit is a complex process consisting of defined quantity of steps, which have as a final goal the ensuring of success of a certain business project. It includes the independent examination of data, statements and financial performances of an enterprise for a stated purpose. It is convenient to construct the Audit Flowcharts or Audit Diagrams for visual representation and structuring the audit processes. ConceptDraw DIAGRAM diagramming software enhanced with Audit Flowcharts solution from the Finance and Accounting area of ConceptDraw Solution Park effectively helps to draw the Audit Diagrams for accounting, finance and money management, the Audit Flowcharts for fiscal information tracking, financial inventories and documenting Six Sigma, the decision making Flow Charts, etc. This solution provides the powerful drawing tools, numerous templates and samples, and large quantity of vector audit flowchart symbols that greatly facilitate the process of representation the audit steps and audit results, and designing efficient and visually appealing Audit Flowcharts.Process Flow Diagrams
A process flow diagram (PFD) is a diagram commonly used in chemical and process engineering to indicate the general flow of plant processes and equipment. ConceptDraw DIAGRAM diagramming and vector drawing software extended with Flowcharts Solution from the "Diagrams" Area of ConceptDraw Solution Park offers the extensive drawing tools for quick and easy design professional looking Process Flow Diagrams. Flow chart ExampleWarehouse Flowchart
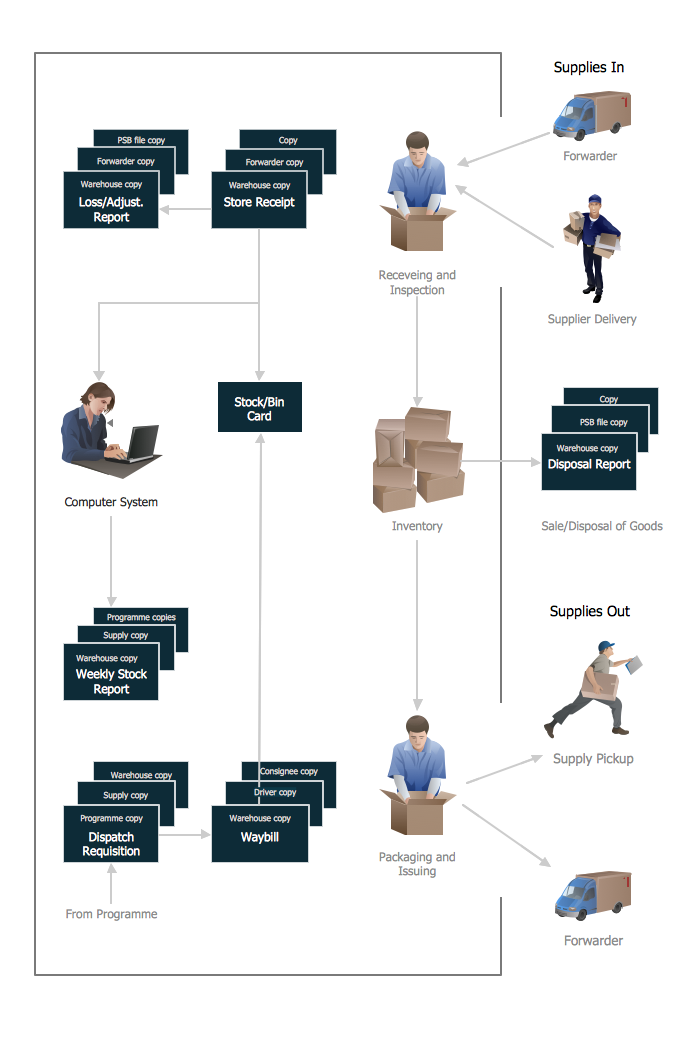
Warehouse Flowcharts are various diagrams that describe the warehousing and inventory management processes on the warehouses. Typical purposes of Warehouse Flowcharts are evaluating warehouse performance, measuring efficiency of customer service and organizational performance. This type of Workflow diagrams can be used for identifying any disconnection between business activities and business objectives. They are effectively used by warehouse-related people and organizations, manufacturers, wholesalers, exporters, importers, transporters, and others.
Standard Warehousing process flow diagram and standard Workflow diagram are used for process identification for further evaluating effectiveness and profitability of overall business process. Use the ConceptDraw DIAGRAM ector graphic software extended with Flowcharts solution to design your own professional-looking Workflow diagrams and Flowcharts of any types, including the Warehouse flowchart, Process flow diagrams which depict in details all steps of Warehouse packages flow.
Microsoft Visio, designed for Windows users, can’t be opened directly on Mac. But fortunately, there are several Visio alternatives for Mac which will help Mac users to work Visio files. With ConceptDraw DIAGRAM , you may open, edit and save files in Visio format.

Is ConceptDraw DIAGRAM an Alternative to Microsoft Visio?
Visio for Mac and Windows - ConceptDraw as an alternative to MS Visio. ConceptDraw DIAGRAM delivers full-functioned alternative to MS Visio. ConceptDraw DIAGRAM supports import of Visio files. ConceptDraw DIAGRAM supports flowcharting, swimlane, orgchart, project chart, mind map, decision tree, cause and effect, charts and graphs, and many other diagram types.Drawing Workflow Diagrams
Drawing workflow diagrams combines both creative and analytic practice. To be the most effective in this process you should find a software that suites this kind of practice. Using ConceptDraw DIAGRAM software for drawing workflow diagrams you get support of features, libraries, templates and samples boosts you creativity and keep you focus on analytic practice, not drawing specifics.Comparing ConceptDraw DIAGRAM to Omnigraffle
Comparing ConceptDraw DIAGRAM to Omnigraffle you can see a lot of benefits of ConceptDraw products. First, the main, ConceptDraw applications are cross-platform and available in two independent and concurrent versions for Macintosh (macOS) and PC (Windows). ConceptDraw gives you the per named license, that you can use simultaneously for your both Macintosh and PC, at work and at home. Free access to the ConceptDraw Solution Park offers you the great number of solutions with hundreds of templates and samples, and thousands of ready-to-use vector objects for quick and easy creation diagrams, drawings, illustrations and Mind Maps. Besides, thanks to Ingyre Technology is provided the integration with Microsoft Office applications and capabilities of limitless exchange the information. The ConceptDraw Live Objects technology lets you design the visual dynamically-updated dashboards, the Rapid Draw technology allows creating the diagrams in minutes. The extensive presentation capabilities help you create lush and beautiful presentation slideshows from your ConceptDraw documents.Sales Steps
Helps to create professionally looking and detailed Sales Flowcharts with all sales steps visually represented on them. Use the Sales Flowcharts Solution for ConceptDraw DIAGRAM software to create your own Sales Flowcharts of any complexity quickly, easily and effectively to use them successfully in your work activity. ConceptDraw DIAGRAM diagramming and vector drawing software supplied with unique Sales Flowcharts solution from the Marketing area of ConceptDraw Solution Park allows fast and easy visualize all sales steps of the sales process on a sales process Map or sales process flowchart, and then realize them easily.Sales Process Flowchart Symbols
The most easier way of creating the visually engaging and informative Sales Process Flowchart is to create the new ConceptDraw document and to use the predesigned vector symbols offered in 6 libraries of the Sales Flowchart Solution. There are more than six types of sales process flow diagrams, ConceptDraw DIAGRAM software is flowchart maker which include six collections of extended flowchart symbols for effective diagramming. There are main collections of color coded flowchart symbols: Sales Department, Sales Steps, Sales Workflow, Sales Symbols and special set of Sales Arrows and Sales Flowchart.Linux Audit Flowchart Example. Flowchart Examples
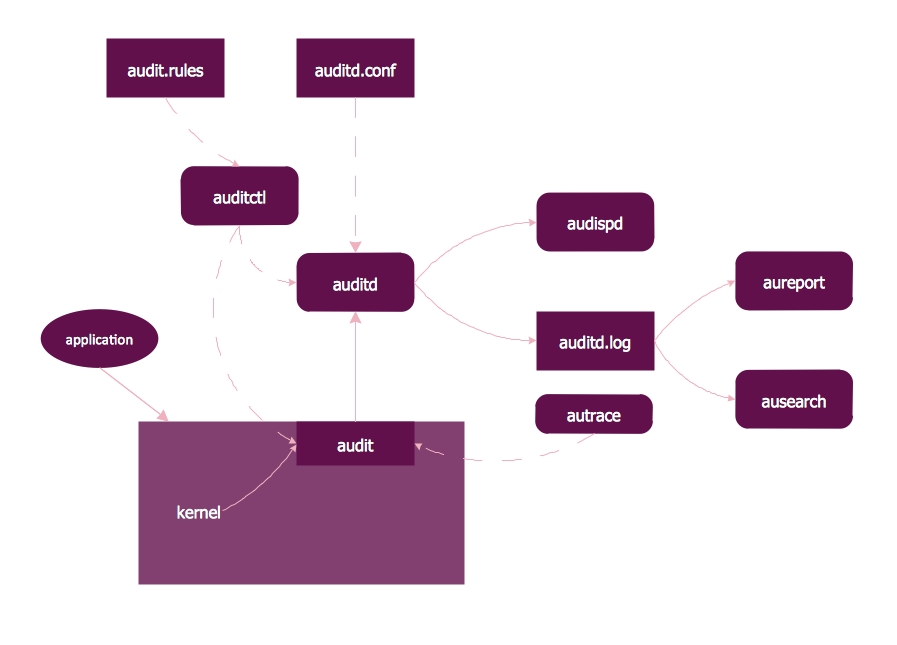
Create your own Linux audit flowcharts using the ConceptDraw DIAGRAM diagramming and vector drawing software extended with the Audit Flowcharts solution from the Finance and Accounting area of ConceptDraw Solution Park. This flowchart example describing auditd, the linux audit tool.Flow Chart Symbols
The Flowcharts are incredibly useful and popular tool used in science, business, software development, analytics, engineering, marketing, manufacturing, administration, architecture, government, politics, and many other fields thanks to a variety of existing types of flowcharts. A Flowchart is a visual graphical representation of the process, algorithm, or the set of steps taken for problem's solution. Widely used for designing, visualizing and documenting simple and complex processes and programs, they effectively help to understand the process and to find easier the flaws if they are. Each flowchart type supposes the use of its own set of notations for drawing corresponding diagram, which includes the symbols of process, decision, data, document, data base, termination, initiation processes, processing loops, conditions, etc. It is easily design a Flowchart using the special professional flowchart maker - ConceptDraw DIAGRAM diagram software with numerous predesigned flow chart symbols grouped in libraries of Flowcharts solution from ConceptDraw Solution Park.UML Component Diagram
UML Component Diagrams are used to illustrate the structure of arbitrarily complex systems and illustrates the service consumer - service provider relationship between components.
Flowchart Software
A Flowchart visualizes a process or algorithm of a program as step blocks composed of shapes, connected with arrows that show the process flow direction. The Flowcharts give users the ability to represent structural data in a visual form and are widely used to visualize the business and technical processes, as well as software algorithms. ConceptDraw DIAGRAM is a powerful Mac OS X and Windows technical diagramming, business diagramming and flowchart drawing software. Numerous vector stencils, built-in templates and samples created by professional designers are included at the basic package. ConceptDraw DIAGRAM is a classic flowchart maker, which exactly follows the industry standards and provides ready-to-use flowchart symbols gathered at the solutions of ConceptDraw Solution Park. Use the free trial versions of ConceptDraw DIAGRAM software for Mac and PC to experience the powerful possibilities of ConceptDraw DIAGRAM in designing the Flowcharts, Flow Diagrams, Business Flow Charts of different types, styles, and degree of complexity.Flowchart Software
Flowchart is a simple diagram, map or graphical schematic representation the sequence of actions within a process. It is ideal for displaying how a process currently flows or can function ideally. The Flowcharts let define the steps and boundaries of a process, uncover problems or miscommunications. The Flowcharts are widely used in education, software development, business, economics, thanks to their visuality they are ideal for presentations, reports, for using on conferences to help the audience comprehend the content better, or easy find flaws in a process flow diagrams. ConceptDraw DIAGRAM is professional flowcharts software and feature-rich flowchart maker, which supports Mac OS X and Windows. It contains at ConceptDraw Solution Park a rich set of stencils and professional flowchart symbols for design. It lets create simply professional-looking Flowcharts based on thousand free flowchart templates, colored symbols and examples. ConceptDraw DIAGRAM is a 3 times cheaper alternative to MS Visio available for both Mac and PC. It’s is another full featured business and technical diagramming application that can easily take care of Visio files within OS X. Another bonus with ConceptDraw DIAGRAM – it's cross-platform. You can work on a document in both OS X and Windows, skipping Visio entirely.
- Import process - Flowchart | TQM Diagram Example
- Import process - Flowchart | Easy Flowchart Program and Standard ...
- Accounting Flowcharts | Accounting Flowcharts | Import process ...
- Import process - Flowchart | Block diagram - Selling technology ...
- Accounting Flowchart Purchasing Receiving Payable and Payment ...
- Import process - Flowchart | Goods Receiving Process Flow Chart
- Import process - Flowchart | How to Add a Cross-Functional ...
- Import process - Flowchart
- Basic Diagramming | Types of Flowchart - Overview | Accounting ...
- Flowcharts | Flow Chart Describing The Import Process


