This site uses cookies. By continuing to browse the ConceptDraw site you are agreeing to our Use of Site Cookies.

Flowcharts

We have a lot of samples of flowchart diagrams for your needs.
"An import is a good brought into a jurisdiction, especially across a national border, from an external source. The purchaser of the exotic good is called an importer. An import in the receiving country is an export from the sending country. Importation and exportation are the defining financial transactions of international trade.
In international trade, the importation and exportation of goods are limited by import quotas and mandates from the customs authority. The importing and exporting jurisdictions may impose a tariff (tax) on the goods. In addition, the importation and exportation of goods are subject to trade agreements between the importing and exporting jurisdictions." [Import. Wikipedia]
The flow chart example "Import process" was created using the ConceptDraw PRO diagramming and vector drawing software extended with the Flowcharts solution from the area "What is a Diagram" of ConceptDraw Solution Park.
Flowchart - Import process
Flowchart - Import process, terminator, process, decision,
Used Solutions

Understanding the Audit Process: A Comprehensive Guide. Audit Process Flowchart

Audit Process Flowchart, Audit Flowchart - Audit Flowcharts solution for ConceptDraw DIAGRAM Solution Park provides the Audit Flowcharts library with wide variety of predesigned audit flowchart symbols, and also the set of templates and samples allowing you design your own audit flowchart or audit process flowchart in one moment. Simply use any of offered samples and change it for your needs, or fill the desired template.

Financial Trade UML Use Case Diagram Example

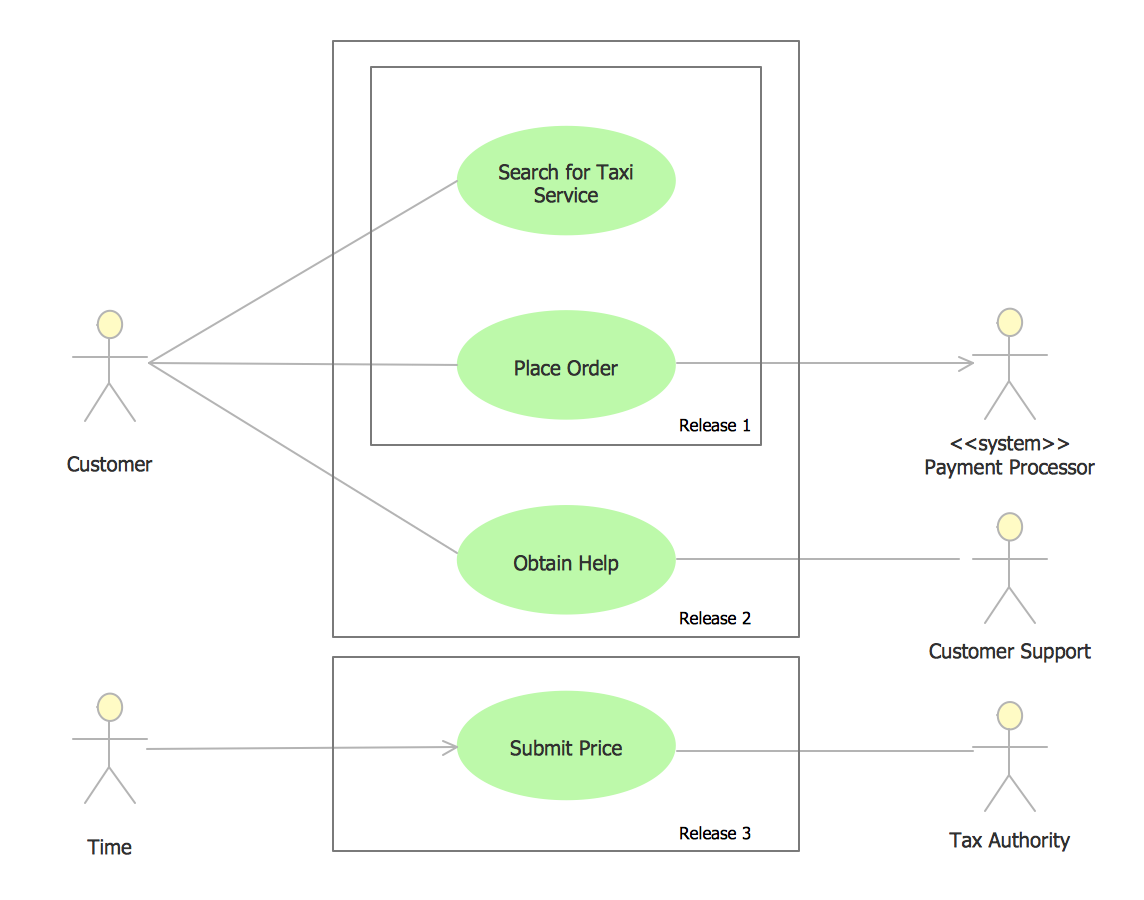
This sample represents the actors, use cases and dependencies between them, and also the relationships between use cases. There are used dependency and use case generalization associations on this UML diagram. Use case generalization is used when you have two similar use cases, but one of them does more than another. This sample shows the work of the Financial Trade sphere and can be used by trading companies, commercial organizations, traders, different exchanges.

cross-functional flowchart template, flowchart, example business process flow Cross-Functional Flowcharts

cross-functional flowchart template, flowchart, example business process flow
The Cross-Functional Flowcharts solution extends ConceptDraw DIAGRAM software with cross functional flowchart examples, samples, and libraries of cross functional flow chart vector design elements and CH-1 symbols for easy drawing professional-looking and illustrative Cross Functional Flowchart, Cross Functional Diagram, CH-1 Diagram, Process Flowchart, Deployment Flowchart, Opportunity Flowchart, Swimlane Process Mapping Diagram, or Visio Cross Functional Flowchart for planning and further analyzing, optimizing and improvement processes. The use of included pre-made cross functional flowchart template, opportunity flowchart template, and swimlane process map template, greatly easier designing your Cross-functional flowcharts.

Types of Flowchart — Overview

When designing a process or an instruction in clear and understandable way, you should consider creating a flowchart. You can avoid spending a lot of time understanding complex concepts as they get clear with different diagrams. The flowcharts are very popular diagram type, they are useful at different fields from the description business processes to the presentation of cooking recipes. Basic Flowchart, Business Process Modeling Diagram, Process Flowchart, Cross Functional Flowchart, Procedure Flowchart, Data Flow Diagram, IDEF Flowchart, SDL Diagram, Workflow Diagram, Document Flowchart, Program Flowchart, Value Stream Map, System Flowchart, Highlight Flowchart, Sales Flowchart are the main types flowchart. The ConceptDraw DIAGRAM is one of the professional applications which has great advantages and using which you can create different types of Flowcharts easy and fast. Try to draw an illustrative and comprehensible diagram in ConceptDraw DIAGRAM describing the processes instead of writing complex long text and make sure how it is convenient. Visio is expensive, and if you use it in a team environment, these costs are compounded. ConceptDraw DIAGRAM is an affordable alternative to Visio and luckily, it comes with a team plan. ConceptDraw DIAGRAM can import and export Visio files, so Mac users can collaborate with PC users stuck on Microsoft's software.
How to Simplify Flow Charting

Flow Chart Creator

ConceptDraw DIAGRAM is a flowchart design software. There are large collections of professional flowchart symbols for process flow diagrams, standard flowchart symbols and colored basic flowchart symbols. Built-in examples and video lessons allow users to get started immediately and do drawing of virtually any type of flowchart or process flow diagrams

Material Requisition Flowchart. Flowchart Examples

Material requisition is a request generated by internal or external organization with a goal to inform the purchase department about the needed items and materials. The requisition can be represented as a written document on a pre-printed form or online request in form of electronic document. The electronic inquisition occupies a leading position in a modern world, now the paper forms are replaced by electronic ordering processes and workflows. The requisition is actively used in business as an internal document for notification the store about the needed goods, in medicine for making the orders on medical equipment and medicaments, in industry for creation request for purchasing some items and materials, and so on. ConceptDraw DIAGRAM ector graphics software extended with Flowcharts solution from the Diagrams area is powerful and useful tool for drawing various types of Flowcharts, including without doubt the Material Requisition Flowchart of any degree of detailing. Succeed in drawing using the large quantity of predesigned flowchart specific shapes, symbols and icons.

SWOT Analysis

The success of the company depends on how successfully it is able to react on different outside influences. When analyzing the external situation, it is necessary to identify the factors most significant on a specified period of time. An interrelated consideration of these factors with the company's possibilities allows to solve effectively appearing problems. One of the most common methods of assessment together internal and external factors influencing the company's development is a SWOT analysis. SWOT analysis (acronym composed of the first letters of the words: strength, weakness, opportunities, threats) is one of the most common and effective types of analysis in marketing and marketing researches. It allows to identify and structure the strengths and weaknesses of an enterprise, as well as potential opportunities and threats of the market, to make conclusion in which direction a given organization needs to develop its business and to formulate the organization's strategy. Use the ConceptDraw MINDMAP software and offered SWOT analysis templates for easy holding SWOT analysis for your company. This Mind Map displays the SWOT analysis for a company and variety of performance measures that influence its work.

process mapping, sipoc diagram, swim lanes, business mapping software, business process map Business Process Mapping

process mapping, sipoc diagram, swim lanes, business mapping software, business process map
The Business Process Mapping solution has a collection of vector graphic libraries, pre-made templates, and examples of the business process maps. They are useful for many business specialists including economists, politicians, analysts, and other economic experts, officials and state managers for making the unique and professionally looking drawings. Use it to create an effective Business process map, SIPOC diagram, Swim lanes flowchart and clearly define the necessary business processes due to their inputs and outputs.
The vector stencils library "HR flowchart" contains 62 flowchart symbols.
Use it to draw your HR flowcharts, workflow diagrams and process charts with the ConceptDraw PRO diagramming and vector drawing software.
The flow chart symbols library "HR flowchart" is included in the HR Flowcharts solution from the Management area of ConceptDraw Solution Park.
Annotation
Annotation, annotation,
Card
Card, card,
Check / audit (diamond)
Check / audit (diamond), check, audit,
Check / audit (square)
Check / audit (square), check, audit,
Collate
Collate, collate,
Comment / note symbol (brace)
Comment / note symbol (brace), brace callout, comment, note,
Communication link
Communication link, communication link,
Compare (diamond)
Compare (diamond), compare,
Compare (square)
Compare (square), compare,
Completed form
Completed form, completed form, document,
Concurrency symbol (fork / join)
Concurrency symbol (fork / join), concurrency symbol,
Conditional selector
Conditional selector, conditional selector,
Control transfer
Control transfer, control transfer,
Data input / output
Data input / output, data input, data output,
Database
Database, database,
Decision
Decision, decision,
Decision indicator - No
Decision indicator - No, decision indicator, no,
Decision indicator - Yes
Decision indicator - Yes, decision indicator, yes,
Delay
Delay, delay,
Direct access storage
Direct access storage, direct access storage,
Disk storage
Disk storage, disk storage,
Display
Display, display,
Divided process (table view)
Divided process (table view), divided process,
Document
Document, document,
Entity (rounded)
Entity (rounded), entity,
Event
Event, event,
Extract
Extract, extract, part, device,
Flow line
Flow line, flow line, arrow, connector,
Internal storage
Internal storage, internal storage,
Junction symbol
Junction symbol, junction symbol,
Lined document
Lined document, lined document,
Lined / shaded process
Lined / shaded process, lined process, shaded process,
Loop limit
Loop limit, loop limit,
Manual file
Manual file, manual file,
Manual input
Manual input, manual input,
Manual operation
Manual operation, manual operation,
Merge
Merge, merge,
Multi document
Multi document, multi document,
Multi process
Multi process, multi process,
Off-page reference - arrow
Off-page reference - arrow, off-page reference,
Off-page reference - incoming
Off-page reference - incoming, off-page reference,
Off-page reference - outgoing
Off-page reference - outgoing, off-page reference,
On-page reference/ Inspection point
On-page reference/ Inspection point, on-page reference, inspection point,
Or
Or, or,
Page
Page, page,
Paper tape
Paper tape, paper tape,
Predefined process
Predefined process, subroutine, predefined process,
Prepare conditional
Prepare conditional, preparation, prepare conditional,
Process step
Process step, process step,
Reference point
Reference point, reference point,
Sequential access storage
Sequential access storage, sequential access storage,
Sort
Sort, sort,
Start (circle)
Start (circle), start,
Start (ellipse)
Start (ellipse), start,
Stickman pictogram
Stickman pictogram, stickman pictogram,
Stored data
Stored data, stored data,
Summary
Summary, summary,
Tagged document
Tagged document, tagged document, document,
Tagged process
Tagged process, tagged process,
Terminal point
Terminal point, terminal point,
Title block
Title block, title block,
Torso pictogram
Torso pictogram, torso pictogram,

process flow diagram, process flow chart Process Flowcharts

process flow diagram, process flow chart
This solution extends ConceptDraw DIAGRAM software with templates, samples, and library of vector shapes for drawing the Process Flowcharts.

Content Marketing Infographics

The popularity of visual content marketing grows day by day. So now simple and convenient designing of professional looking Content Marketing Infographics becomes increasingly actual. For achievement this goal ConceptDraw DIAGRAM software offers the Marketing Infographics Solution from the Business Infographics Area.

Create Process Flowcharts

A process flowchart is a picture of the separate steps of a process in sequential order.Use ConceptDraw DIAGRAM software and the vector stencils from object libraries are designed objects you can use adding to process flowcharts for the best result.

Transport hazard pictograms, transport ghs pictograms download, transport hazard symbols Transport Hazard Pictograms

Transport hazard pictograms, transport ghs pictograms download, transport hazard symbols
Transport Hazard Pictograms solution includes large variety of specially developed samples with transport hazard symbols and pictograms, and the whole set of predesigned vector transport GHS pictograms download and used with ease from the Transport Hazard Pictograms library. Apply them for quick designing professional-looking infographics and diagrams, use them to create warning signboards and announcements on all stages of the transportation process, to place them on the transport vehicles and warehouses of transportation companies, at the transport documentation and on the websites of transport and logistics companies.

economic system, infographic, infographic examples, market economy, best infographics, economic activities Economy Infographics

economic system, infographic, infographic examples, market economy, best infographics, economic activities
The Economy Infographics solution provides a large collection of vector icon libraries, drawing samples and infographic examples for quick and simple design of the best infographics, illustrations, and presentations about economics, markets, economic policy, business, finances, government and social institutions, production, distribution, and consumption of goods and services, economic diagrams and schemes, economic activities designs, continent and country economic maps, economic presentations, market economy and economic system infographic charts, illustrations in economic articles, reports in mass media, and blog posts in social media. It is a valuable tool for wide range of economists, politicians, managers, marketing experts, business analysts, journalists and bloggers focusing on economy, educators and students studying economics, and many other people to communicate visually the economic information.

Human Resource Development

Human Resource Development (HRD) focuses on the help employees develop their personal and organizational skills, abilities, and knowledge, HRD also helps to adapt an organization to the changing of external environment. ConceptDraw DIAGRAM diagramming and vector drawing software supplied with HR Flowcharts Solution from the Management Area of ConceptDraw Solution Park can effectively help in labour-intensive process of human resource development.

SWOT Analysis Solution - Strategy Tools

The condition and successful development of the company depends on how efficiently it is able to react on different outside influences. Analysis and interrelated consideration of external factors and the company's capabilities allow effectively solve appearing problems. One of the most common methods of evaluation together internal and external factors influencing the company's development is SWOT analysis elaborated for business and industry. It is a necessary element of researches and obligatory preliminary stage at the preparation of strategic and marketing plans of the company. Upon the results of SWOT analysis, we can assess does the company have the internal forces and resources to realize the existing opportunities and resist external threats, and what internal deficiencies require the prompt rectification. ConceptDraw DIAGRAM software enhanced with SWOT Analysis solution offers powerful drawing and strategy tools for effective execution the SWOT and TOWS analysis for your company with a goal of effectively realizing strategic planning and correct decision-making.
This market value pyramid diagram has 5 levels:
1) Essence (Who we are),
2) Competitive positioning (Where we play),
3) Customer benefits (Value proposition),
4) Product / Service features (Value delivery),
5) Internal capabilitiea (Value requirements).
Use this triangular scheme to develop your marketing strategy.
"Market value or OMV (Open Market Valuation) is the price at which an asset would trade in a competitive auction setting. Market value is often used interchangeably with open market value, fair value or fair market value, although these terms have distinct definitions in different standards, and may differ in some circumstances." [Market value. Wikipedia]
The triangle chart example "Market value" was created using the ConceptDraw PRO diagramming and vector drawing software extended with the Pyramid Diagrams solution from the Marketing area of ConceptDraw Solution Park.
Pyramid diagram
Pyramid diagram, pyramid, triangle,

systems engineering, sysml SYSML

systems engineering, sysml
In order to make a SysML-related drawing, the ConceptDraw DIAGRAM charting and drawing software can be used. Also, the SysML solution can be found as an extension to the ConceptDraw DIAGRAM application, enabling all those with systems engineering background to use the offered tools for creating the needed systems process models in order to use in the professional documentation for either distribution or analysis. Offering the vector stencil libraries full of the icons that may relate to each of the 9 official diagrams used in SysML, the SysML solution is useful for many system engineers.