This site uses cookies. By continuing to browse the ConceptDraw site you are agreeing to our Use of Site Cookies.

Basic of Flowchart: Meaning and Symbols

Flowcharts are the best for visually representation the business processes and the flow of a custom-order process through various departments within an organization. ConceptDraw DIAGRAM diagramming and vector drawing software extended with Flowcharts solution offers the full set of predesigned basic flowchart symbols which are gathered at two libraries: Flowchart and Flowcharts Rapid Draw. Among them are: process, terminator, decision, data, document, display, manual loop, and many other specific symbols. The meaning for each symbol offered by ConceptDraw gives the presentation about their proposed use in professional Flowcharts for business and technical processes, software algorithms, well-developed structures of web sites, Workflow diagrams, Process flow diagram and correlation in developing on-line instructional projects or business process system. Use of ready flow chart symbols in diagrams is incredibly useful — you need simply drag desired from the libraries to your document and arrange them in required order. There are a few serious alternatives to Visio for Mac, one of them is ConceptDraw DIAGRAM. It is one of the main contender with the most similar features and capabilities.
How to Build a Flowchart

Scrum process work items and workflow

Teams working with Scrum methodology use the product backlog items (PBIs), bug work item types (WITs), reports and dashboards. SCRUM Workflow solution for ConceptDraw DIAGRAM software offers collection of samples, variety of predesigned objects, clipart and graphic elements, a set of Scrum process work items and workflow which are developed for agile teams working using Scrum.

Flowcharts

We have a lot of samples of flowchart diagrams for your needs.

scrum, agile methodology, scrum methodology, scrum board Scrum Workflow

scrum, agile methodology, scrum methodology, scrum board
The Scrum Workflow Solution extends the capabilities of ConceptDraw DIAGRAM with a large collection of professionally-designed samples and a selection of ready-to-use scrum design elements: scrum diagrams and arrows, scrum icons of people, artifacts, workflow, workspace and other colorful scrum clipart, and also scrum charts.

logistics flow charts, logistics planning, logistics and supply chain, logistics management software, inventory flow chart Logistics Flow Charts

logistics flow charts, logistics planning, logistics and supply chain, logistics management software, inventory flow chart
Logistics Flow Charts solution extends ConceptDraw DIAGRAM functionality with opportunities of powerful logistics management software. It provides large collection of predesigned vector logistic symbols, pictograms, objects and clipart to help you design with pleasure Logistics flow chart, Logistics process flow diagram, Inventory flow chart, Warehouse flowchart, Warehouse management flow chart, Inventory control flowchart, or any other Logistics diagram. Use this solution for logistics planning, to reflect logistics activities and processes of an enterprise or firm, to depict the company's supply chains, to demonstrate the ways of enhancing the economic stability on the market, to realize logistics reforms and effective products' promotion.

Best Value Stream Mapping mac Software

Create value stream maps - for value stream analysis and value stream management, material and information flow mapping, using our quick start templates included with ConceptDraw.

sales process map, sales process flowchart, sales steps, sales process management Sales Flowcharts

sales process map, sales process flowchart, sales steps, sales process management
The Sales Flowcharts solution lets you create and display sales process maps, sales process workflows, sales steps, the sales process, and anything else involving sales process management.

Business Management Package

Business Management Package is a large set of graphical solutions from the ConceptDraw Solution Park. They are selected to help in solving the business, management, marketing and quality tasks in a best way. It is useful for many management specialists, marketing experts, business specialists, international business experts, IT managers, specialists in managing the business processes, financial specialists, and other business related specialists. Create documents, reports, statistical summaries, describe business processes, build business models for many fields including finance, education, logistic, landscape design, health, cooking, and many more.

Types of Flowcharts

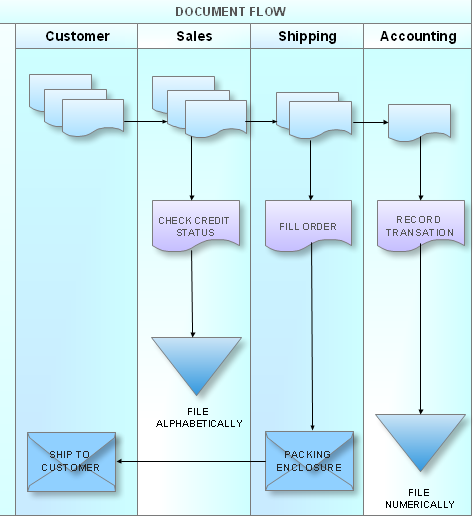
A Flowchart is a graphical representation of process, algorithm, workflow or step-by-step solution of the problem. It shows the steps as boxes of various kinds and connects them by arrows in a defined order depicting a flow. There are twelve main Flowchart types: Basic Flowchart, Business Process Modeling Diagram (BPMN), Cross Functional Flowchart, Data Flow Diagram (DFD), IDEF (Integrated DEFinition) Flowchart, Event-driven Process Chain (EPC) Diagram, Influence Diagram (ID), Swimlane Flowchart, Process Flow Diagram (PFD), Specification and Description Language (SDL) Diagram, Value Stream Mapping, Workflow Diagram. Using the Flowcharts solution from the Diagrams area of ConceptDraw Solution Park you can easy and quickly design a Flowchart of any of these types. This solution offers a lot of special predesigned vector symbols for each of these widely used notations. They will make the drawing process of Flowcharts much easier than ever. Pay also attention for the included collection of ready Flowchart examples, samples and quick-start templates. This is business process improvement tools. If you are looking for MS Visio for your Mac, then you are out of luck, because it hasn't been released yet. However, you can use Visio alternatives that can successfully replace its functions. ConceptDraw DIAGRAM is an alternative to MS Visio for Mac that provides powerful features and intuitive user interface for the same.
How to Simplify Flow Charting

Scrum

What is Scrum? Scrum is the famous agile software development methodology which depicts an iterative and incremental approach for the work on the complex projects. Use ConceptDraw DIAGRAM diagramming and vector drawing software extended with SCRUM Workflow solution to draw various types of professional-looking Scrum Charts, Scrum Workflow Diagrams, Scrum Mind Maps, Scrum boards and attractive Scrum Infographics.

Fishbone Software Tools for Design Element

Cause and Effect diagram (Ishikawa diagram or Fishbone diagram) software helps you to show in one diagram the factors of Equipment, People, Process, Environment, Management and Materials, which all in general affect the overall problem and gives the base for the further analysis. ConceptDraw DIAGRAM is perfect software for designers and software developers who need to create Fishbone diagrams. You will get a simple problem-analysis tool - Fishbone software tools for design element to easy construct specific diagrams and identify many possible causes for an effect to attack complex problem solving.

business processes, business management, plan projects Business Package for Management

business processes, business management, plan projects
Package intended for professional who designing and documenting business processes, preparing business reports, plan projects and manage projects, manage organizational changes, prepare operational instructions, supervising specific department of an organization, workout customer service processes and prepare trainings for customer service personal, carry out a variety of duties to organize business workflow.
The vector stencils library "Scrum artifacts" contains 52 icons.
Use this clipart set to design your agile software development diagrams and infographics with ConceptDraw PRO software.
"Product backlog
The product backlog comprises an ordered list of requirements that a scrum team maintains for a product. It consists of features, bug fixes, non-functional requirements, etc.—whatever must be done to successfully deliver a viable product. The product owner orders the product backlog items (PBIs) based on considerations such as risk, business value, dependencies, and date needed. ...
Sprint backlog
The sprint backlog is the list of work the development team must address during the next sprint. The list is derived by the scrum team selecting product backlog items from the top of the product backlog until the development team feels it has enough work to fill the sprint. This is done by the development team asking "Can we also do this?" and adding product backlog items to the sprint backlog. The development team should keep in mind its past performance assessing its capacity for the new sprint, and use this as a guide line of how much "effort" they can complete.
The product backlog items may be broken down into tasks by the development team. Tasks on the sprint backlog are never assigned; rather, tasks are signed up for by the team members as needed according to the set priority and the development team member skills. This promotes self-organization of the development team, and developer buy-in. ...
Sprint burn-down chart
The sprint burndown chart is a public displayed chart showing remaining work in the sprint backlog. Updated every day, it gives a simple view of the sprint progress. ...
Release burn-down chart
The release burndown chart is the way for the team to track progress and provide visibility. The release burndown chart is updated at the end of each sprint by the scrum master. The horizontal axis of the release burndown chart shows the sprints; the vertical axis shows the amount of work remaining at the start of each sprint." [Scrum (software development). Wikipedia]
The clip art sample "Design elements - Scrum artifacts" is included in the Scrum solution from the Project Management area of ConceptDraw Solution Park.
Clipart set
Clipart set, velocity, user story, tracer bullet, team velocity chart, task, unstarted, task, ongoing, task, completed, task, story points, story card, sprint story tasks, sprint story, sprint review meeting, sprint retrospective meeting, sprint planning meeting, sprint goal, sprint burndown chart, sprint backlog list, SBL, sprint backlog, sprint, spike, software product, scrumbut, scrumban, scrum theme, scrum task board, scrum task, scrum story, scrum release, scrum poker, scrum of scrums, scrum meeting, scrum epic, scrum, sashimi, return on investment (ROI), release burndown chart, recycle bin, product backlog, project backlog, release backlog, product backlog list, PBL, product backlog item, PBI, planning game, pig, objective, non-functional requirement (NFR), impediment, functional requirement, feature, daily scrum meeting, chicken, abnormal termination, Potentially shippable increment, PSI, product increment, potentially releasable increment, Definition of Done, DoD,

histogram, flow chart, pareto chart, fishbone diagram, quality control Seven Basic Tools of Quality

histogram, flow chart, pareto chart, fishbone diagram, quality control
Seven Basic Tools of Quality solution is useful for all ConceptDraw DIAGRAM users, giving them a particular set of different graphical techniques helping on focus on such activity as identifying the root cause of many quality-related issues. This solution offers the well-known visual tools helpful in representing all the data related to different quality initiatives. Some of such tools are the pre-made templates useful for making different fishbone diagrams, Pareto charts, and histograms. It is ideal for all who want to manage quality control throughout an organization by using a modern tool.

diagram, workflow, flowchart, orgchart, marketing, management, infographics Business Diagrams Package

diagram, workflow, flowchart, orgchart, marketing, management, infographics
Business Diagrams Package is a large set of comprehensive graphical solutions from the ConceptDraw Solution Park, which are powerful in solving the business, marketing and quality tasks in completely different fields, such as finance, education, health food and cooking, HR, and many others. The tools of this package's solutions are a powerful assistant in drawing all diversity of Financial and Marketing infographics, Business process workflow diagrams, Organizational charts, Education infographics, Quality diagrams, Health food diagrams, HR flowcharts, as well as different graphics and charts, which depict the values of key business indicators, their dependencies, give the full understanding of a situation within a company and on the market.

Human Resource Management

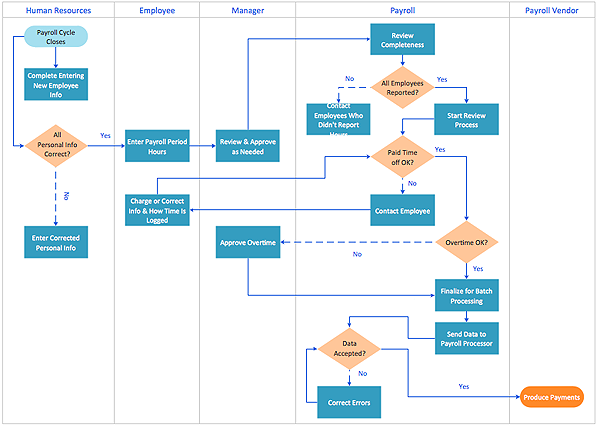
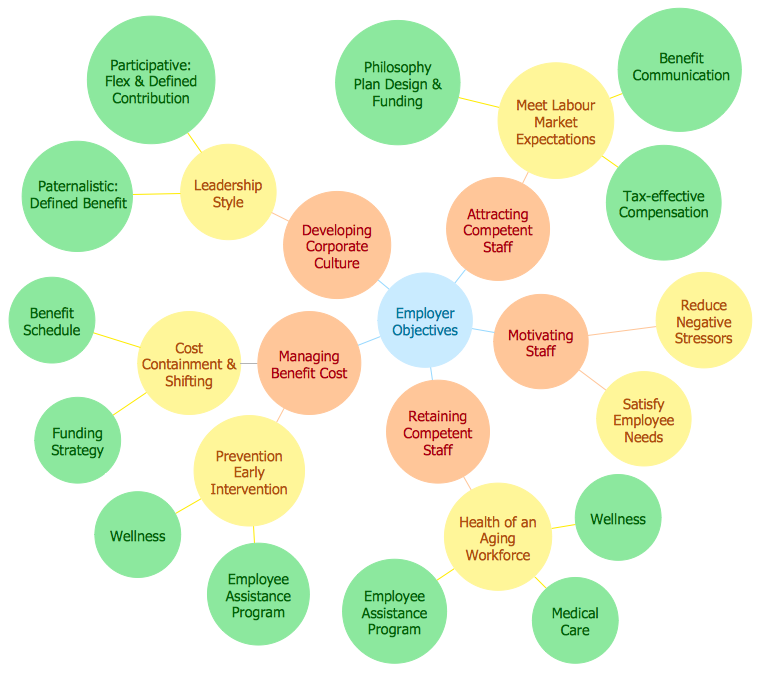
ConceptDraw DIAGRAM diagramming and vector drawing software enhanced with powerful HR Flowcharts Solution from the Management Area of ConceptDraw Solution Park perfectly suits for Human Resource Management.

human resources, human resource management, recruitment, hiring process, human resource development HR Flowcharts

human resources, human resource management, recruitment, hiring process, human resource development
The HR Flowcharts solution is ideal for using while creating the HR-related drawings in the ConceptDraw DIAGRAM charting and drawing software, providing with a comprehensive collection of human resources themed icons, connectors, and images from the available stencil libraries, helping illustrating flowcharts, infographics and workflow diagrams.
The vector stencils library "Scrum people" contains 30 icons: scrum master, product owner, development team, etc.
Use this clipart set to design your agile software development diagrams and infographics with ConceptDraw PRO software.
"There are three core roles in the scrum framework. These core roles are those committed to the project in the scrum process — they are the ones producing the product (objective of the project). They represent the scrum team. ...
Product owner
The product owner represents the stakeholders and is the voice of the customer, who is accountable for ensuring that the team delivers value to the business. The product owner writes (or has the team write) customer-centric items (typically user stories), ranks and prioritizes them, and adds them to the product backlog. ...
Development team
The development team is responsible for delivering potentially shippable increments (PSIs) of product at the end of each sprint (the sprint goal). A team is made up of 3–9 individuals who do the actual work (analyse, design, develop, test, technical communication, document, etc.). Development teams are cross-functional, with all of the skills as a team necessary to create a product increment. The development team in scrum is self-organizing...
Scrum master
Scrum is facilitated by a scrum master, who is accountable for removing impediments to the ability of the team to deliver the product goals and deliverables. The scrum master is not a traditional team lead or project manager, but acts as a buffer between the team and any distracting influences. The scrum master ensures that the scrum process is used as intended. The scrum master helps ensure the team follows the agreed scrum processes, often facilitates key sessions, and encourages the team to improve." [Scrum (software development). Wikipedia]
The clip art sample "Design elements - Scrum people" is included in the Scrum solution from the Project Management area of ConceptDraw Solution Park.
Icon set
Icon set, whole team, tester, team member, team lead, support staff, stakeholder, software architect, senior manager, scrum team, scrum master, scrum evangelist, remote team member, project manager, programmer, product owner, product manager, power user, operations staff, mobile phone, light bulb, gold owner, external system team, end user, domain expert, developers, designer, customer, cross-functional team, change control board, business analyst, bug, banknote bundle, auditor, architecture owner, arc arrow, QA, quality assurance,