Transportation Infographics
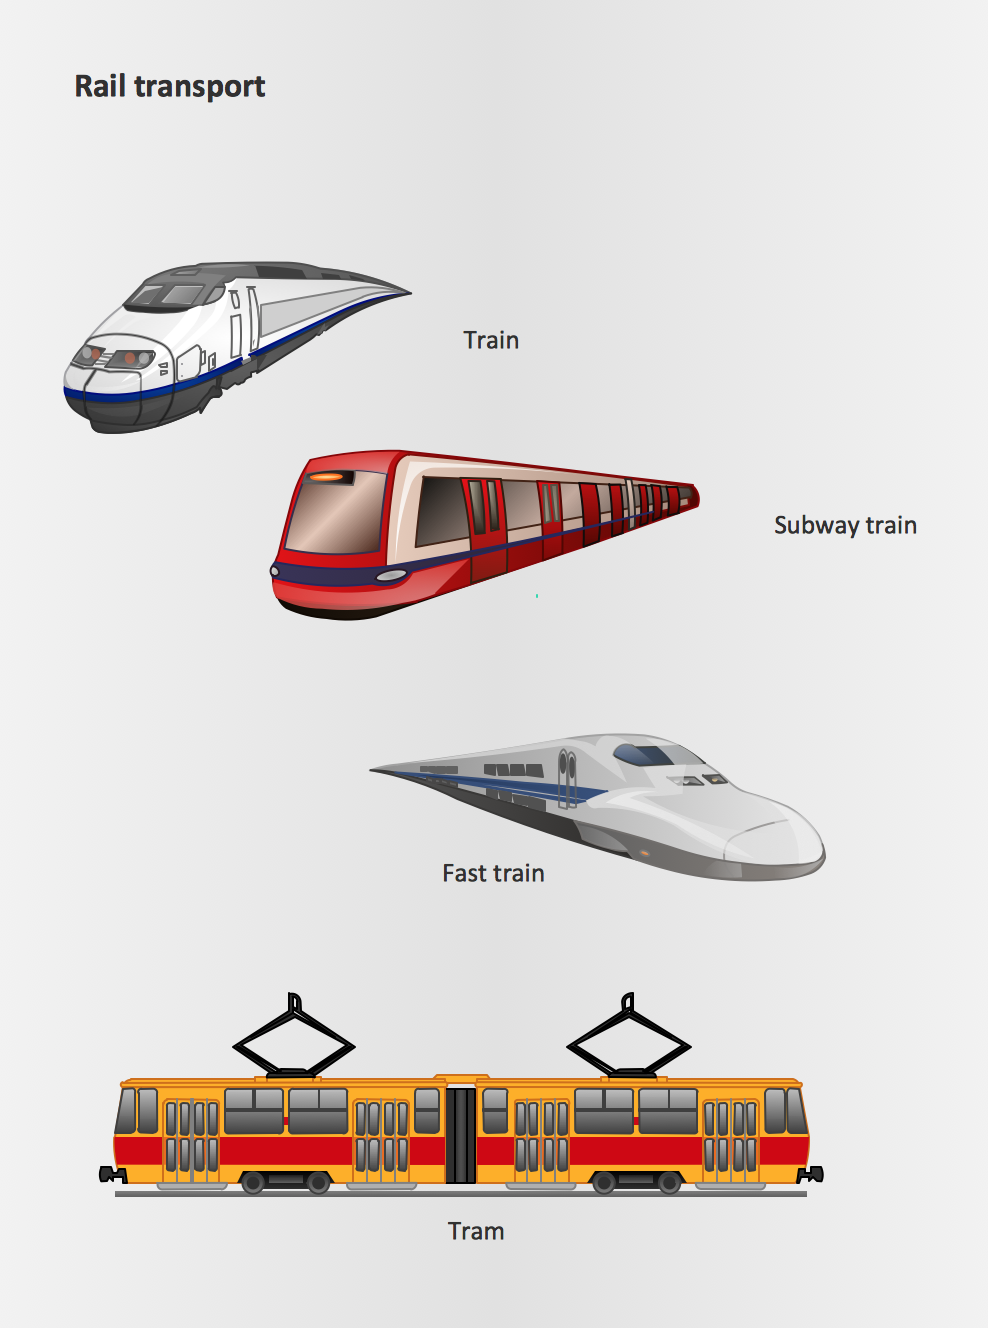
ConceptDraw is a visualization Software for making transportation infographics. Infographics design vector elements and vector graphics which will surely help you in your design process.Rail transport - Design elements
The vector stencils library Rail transport contains clipart of railway transport for ConceptDraw PRO diagramming and vector drawing software. Use it to draw illustrations of trains and transportation of passengers and goods by railroads.Road Transport - Design Elements
Samples, templates and libraries contain vector clip art for drawing the Road Transport Illustrations.Project management - Design Elements
These vector illustrations and cliparts are created using ConceptDraw PRO for drawing the Project management Illustrations and contain plenty of project management design elements. The clipart library Project management includes 35 icons. This symbols used by the best marketing project management software, typically by project management reporting software for presentation on project status and results.UML Class Diagram Example for Transport System
This sample was created in ConceptDraw PRO diagramming and vector drawing software using the UML Class Diagram library of the Rapid UML Solution from the Software Development area of ConceptDraw Solution Park. This sample shows the transport protocol mappings for SNMP (Simple Network Management Protocol), the classes of the transport system and relationships between them and is used in IP network.Flow chart Example. Warehouse Flowchart
Warehouse Flowcharts are various diagrams that describe the warehousing and inventory management processes on the warehouses. Typical purposes of Warehouse Flowcharts are evaluating warehouse performance, measuring efficiency of customer service and organizational performance. This type of Workflow diagrams can be used for identifying any disconnection between business activities and business objectives. They are effectively used by warehouse-related people and organizations, manufacturers, wholesalers, exporters, importers, transporters, and others. Standard Warehousing process flow diagram and standard Workflow diagram are used for process identification for further evaluating effectiveness and profitability of overall business process. Use the ConceptDraw PRO vector graphic software extended with Flowcharts solution to design your own professional-looking Workflow diagrams and Flowcharts of any types, including the Warehouse flowchart, Process flow diagrams which depict in details all steps of Warehouse packages flow. Microsoft Visio, designed for Windows users, can’t be opened directly on Mac. But fortunately, there are several Visio alternatives for Mac which will help Mac users to work Visio files. With ConceptDraw PRO, you may open, edit and save files in Visio format.
 Aerospace and Transport
This solution extends ConceptDraw PRO software with templates, samples and library of vector clipart for drawing the Aerospace and Transport Illustrations. It contains clipart of aerospace objects and transportation vehicles, office buildings and anci
HelpDesk
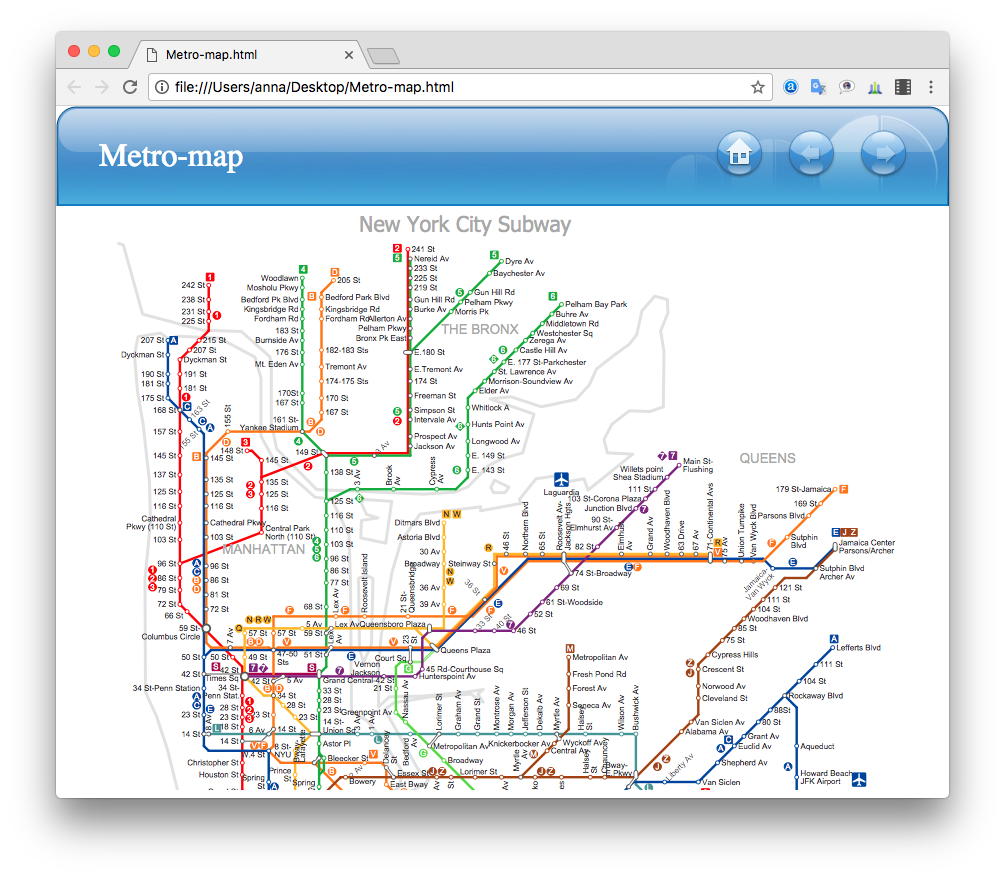
How to Make a Web Page from Your Metro Map
Using ConceptDraw PRO, you can create metro maps, route maps and various transport schemes. It is easy for anyone to build a map, one does not needed to be a cartographer to make good use of the ConceptDraw mapping solutions. Elaborate maps can be quickly assembled and then used on the web, printed, or made into signage. Graphical power and ease of use are built into the ConceptDraw mapping solutions. You can save your drawing as a Web pages. ConceptDraw PRO adds the HTML tags that are needed to display your diagrams in a Web browser, so all you have to do is design their appearance.
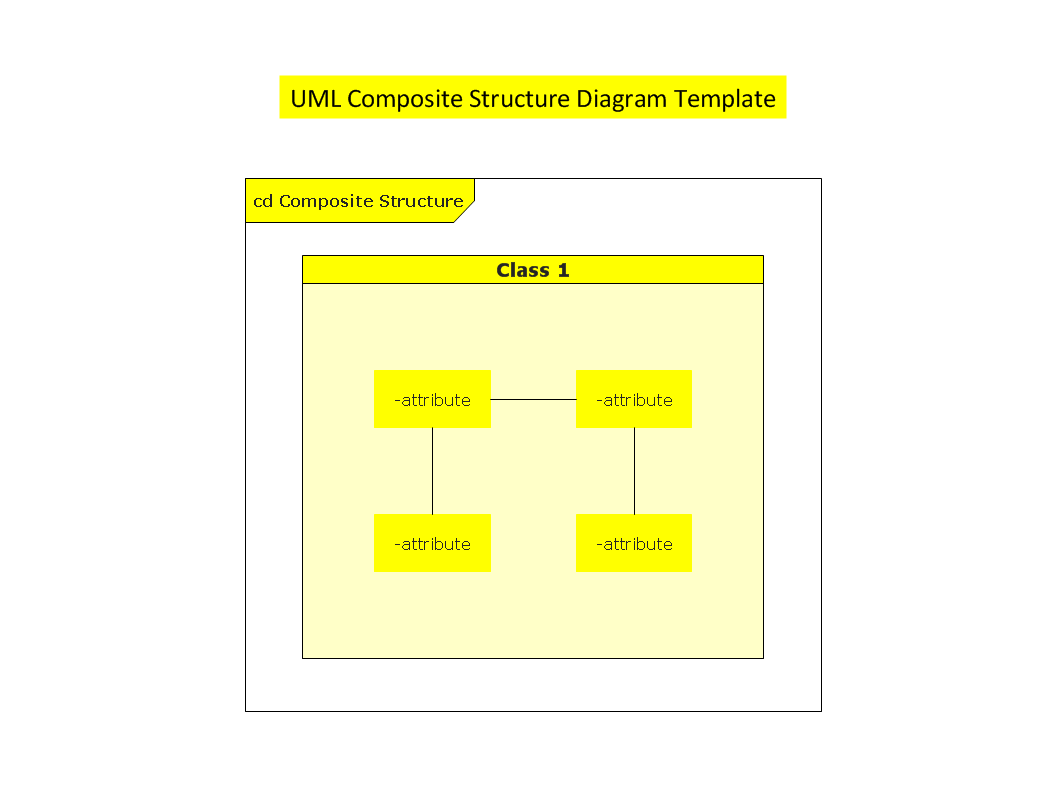
UML Composite Structure Diagram
UML Composite Structure Diagram shows the internal structure of a class and the possible interactions at this structure.
Design Pictorial Infographics. Design Infographics
In the course of recent decades data visualization went through significant development and has become an indispensable tool of journalism, business intelligence and science. The way visual information may be conveyed is not limited simply to static or dynamic representation, it can also be interactive. Infographics can be conditionally divided into several general levels. Primarily, this is level of visualization of information, its interpretation and association on any ground. Second level can be defined as a visualization of knowledge, depiction of thoughts and ideas in the form of images or diagrams. Finally, the level of data visualization, which processes data arrays in charts, enabling the information to be more clearly perceived. You can also identify the main approaches to the creation of infographics: exploratory and narrative. Exploratory method insists on minimalist design in favor of data precision without unnecessary details and is common for scientific researches and anaBuilding Drawing Design Element: Machines and Equipment
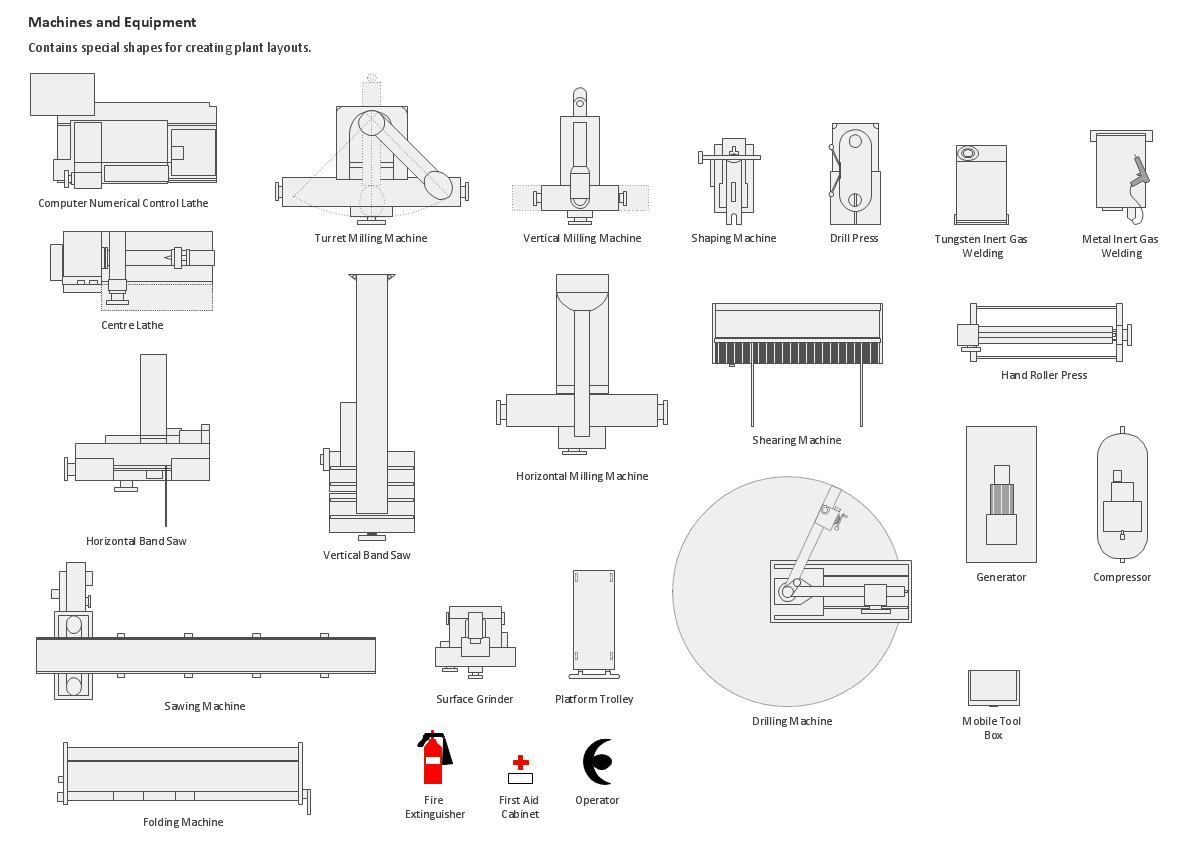
Use ConceptDraw to develop the plant layouts for production, storage, distribution, transport, shipping, and receiving of manufactured goods.
UML Deployment Diagram Example - ATM System UML diagrams
The UML Deployment Diagram is used for visualization of elements and components of a program, that exist at the stage of its execution. It contains graphical representations of processors, devices, processes, and relationships between them. The UML Deployment Diagram allows to determine the distribution of system components on its physical nodes, to show the physical connections between all system nodes at the stage of realization, to identify the system bottlenecks and reconfigure its topology to achieve the required performance. The UML Deployment diagram is typically developed jointly by systems analysts, network engineers and system engineers. ConceptDraw PRO diagramming and vector drawing software with Rapid UML solution from Software Development area of ConceptDraw Solution Park perfectly suits for designing different types of UML diagrams, including the UML Deployment Diagrams. There are included a lot of design elements, templates, examples and samples, among them an example of work of ATM (Automated Teller Machine) banking system.How to draw Metro Map style infographics? (Los Angeles)
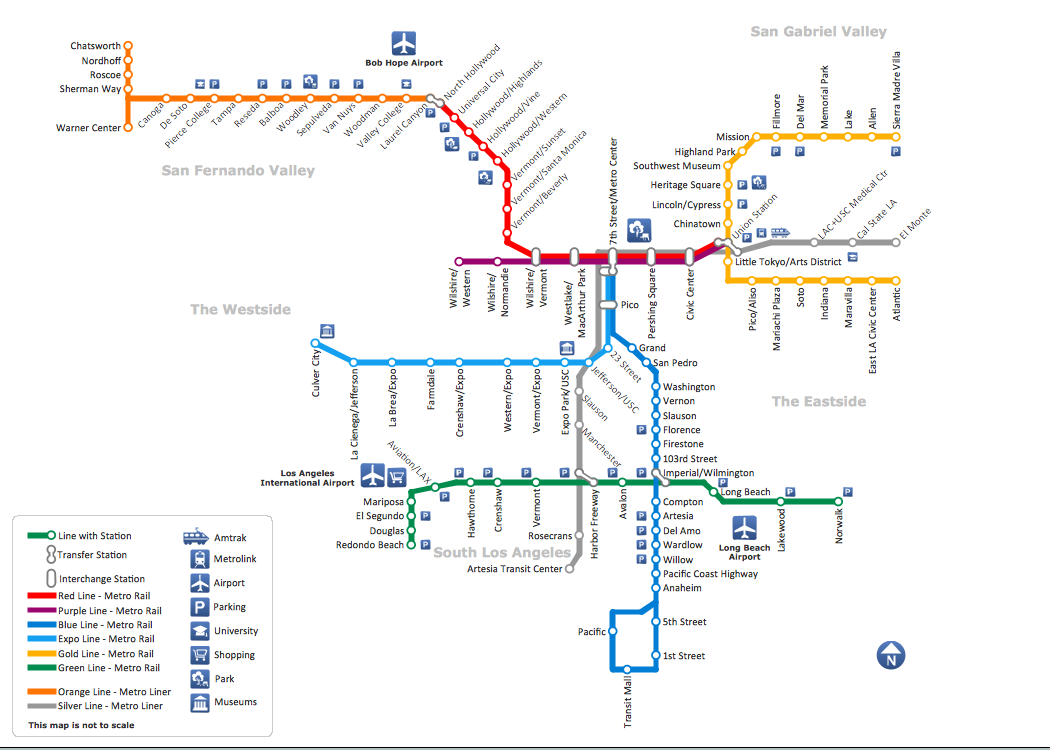
Tool to draw Metro Map styled inforgraphics. Los Angeles Metro Rail and Liner sample. This is a one-click tool to add stations to the map. It lets you control the direction in which you create new stations, change lengths, and add text labels and icons. It contains Lines, Stations, and Landmarks objects.
 Metro Map
Metro Map solution extends ConceptDraw PRO software with templates, samples and library of vector stencils for drawing the metro maps, route maps, bus and other transport schemes, or design tube-style infographics.
This flowchart example was created on the base of land sales process diagram from the Property management webpage of the VicRoads website.
[www.vicroads.vic.gov.au/ planning-and-projects/ property-services/ property-management]
"VicRoads or the Roads Corporation of Victoria is a statutory corporation which is the state road and traffic authority in the state of Victoria, Australia. It is responsible for maintenance and construction of the state arterial road network, as well as driver licensing and vehicle registration. VicRoads has broad responsibility for road safety policy and research. It is also responsible for regulating the accident towing industry in Victoria." [VicRoads. Wikipedia]
"Sales Process.
Once it has been established with the relevant VicRoads Regions/ Projects and other business areas that properties are identified as surplus to VicRoads’ operational needs, they are incorporated in the VicRoads annual sales program.
Following approval: relevant VicRoads Regional Manager and the VicRoads Chief Executive (and in some circumstances Minster for Public Transport and Roads) must approve all land deemed surplus and available for disposal.
The method of sale is then determined and consultant advice is sought:
(1) Planning.
(2) Valuer General Victoria (Valuer General’s office must provide a valuation for all sales).
(3) Government Land Monitor (Land Monitor approval is sought if the value exceeds $750,000).
(4) Environmental.
(5) Local Council." [www.vicroads.vic.gov.au/ planning-and-projects/ property-services/ property-management]
The example "Land sales process flowchart" was created using the ConceptDraw PRO diagramming and vector drawing software extended with the Sales Flowcharts solution from the Marketing area of ConceptDraw Solution Park.
- Transport Flowchart
- Flow Chart For Transport Management System
- Flow Chart Of Transport Manage Net System
- Data Flow Diagrams (DFD) | Audit Flowcharts | UML Use Case ...
- Flow Chart Different Mesns Of Transport
- Aerospace and Transport | Process Flowchart | Road transport ...
- Flowchart Transport
- Flow chart Example. Warehouse Flowchart | Road Transport ...
- Aerospace and Transport | Flowchart Of A Bulldozer
- Basic Flowchart Symbols and Meaning | IDEF1X Standard | Design ...
- Process Flowchart | Road Transport - Design Elements | Aerospace ...
- Mode Of Transport System Flow Chart
- Flow chart Example. Warehouse Flowchart | UML Class Diagram ...
- Flow chart Example. Warehouse Flowchart | Accounting Flowcharts ...
- Flow Chart For Means Of Transport For Kids
- ConceptDraw Solution Park | Flowchart Of Means Of Transport Pics
- Aerospace - Design Elements | Basic Flowchart Symbols and ...
- Flow Chart Showing Means Of Transportation
- Road Transport - Design Elements | Basic Flowchart Symbols and ...
- Aerospace and Transport | Flowchart Food Truck Restaurant

