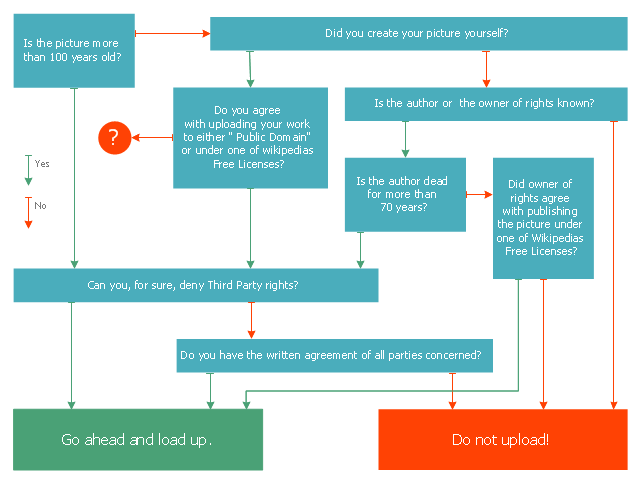
This marketing diagram sample represents decision tree. It was redesigned from the Wikimedia Commons file: Decision Tree on Uploading Imagesv2.svg.
[commons.wikimedia.org/ wiki/ File:Decision_ Tree_ on_ Uploading_ Imagesv2.svg]
"A decision tree is a decision support tool that uses a tree-like graph or model of decisions and their possible consequences, including chance event outcomes, resource costs, and utility. It is one way to display an algorithm.
Decision trees are commonly used in operations research, specifically in decision analysis, to help identify a strategy most likely to reach a goal. ...
A decision tree is a flowchart-like structure in which internal node represents test on an attribute, each branch represents outcome of test and each leaf node represents class label (decision taken after computing all attributes). A path from root to leaf represents classification rules.
In decision analysis a decision tree and the closely related influence diagram is used as a visual and analytical decision support tool, where the expected values (or expected utility) of competing alternatives are calculated.
A decision tree consists of 3 types of nodes:
(1) Decision nodes - commonly represented by squares.
(2) Chance nodes - represented by circles.
(3) End nodes - represented by triangles.
Decision trees are commonly used in operations research, specifically in decision analysis, to help identify a strategy most likely to reach a goal." [Decision tree. Wikipedia]
The marketing diagram example "Decision tree" was created using the ConceptDraw PRO diagramming and vector drawing software extended with the Marketing Diagrams solution from the Marketing area of ConceptDraw Solution Park.
How to Build a Flowchart
The ConceptDraw DIAGRAM is a professional software for quick creating great looking flowcharts. The vector stencils from object libraries allows you to use RapidDraw technology. By the clicking on direction arrows one can add new object to flowcharts. This technology gives to users the ability to fast creating visualization for the structural data. Learn the basics of flowcharting and see how to build create a flowchart using ConceptDraw automatic drawing tools.Accounting Flowchart Symbols
Accounting is a well known and popular tool used for gaining full quantitative information about the finances. The accounting process includes extensive set of activities that begins with transactions and ends with closing of books. It contains all financial information for a given organization, the data about incomes, expenditures, purchases, sales, return, payroll, and many other numerical information. The excellent possibility to create great-looking Accounting Flowcharts is offered by professional ConceptDraw DIAGRAM diagramming and vector drawing software. It includes the Accounting Flowcharts solution containing wide variety of predesigned accounting flowchart symbols. All symbols are easy recognizable, commonly used, vector and professionally designed, so are capable effectively save your time and efforts when representing all stages of accounting work process, the flow of data in an organization, accounting procedures and processes, documents, tasks, responsible people, users, components and authorizations.Chart Examples
Easy charting software comes with beautiful chart templates and examples. This makes it easy to create professional charts without prior experience.Bubble Chart Maker
ConceptDraw DIAGRAM diagramming and vector drawing software extended with Business Diagrams Solution from the Management Area is a powerful Bubble Chart Maker.Mac OS User Interface Design Examples
ConceptDraw DIAGRAM is a powerful diagramming and vector drawing GUI software. Extended with Mac OS User Interface solution from the Software Development area, ConceptDraw DIAGRAM is the best software for designing professional looking user interfaces for new OS X 10.10 Yosemite operating system developed for Macintosh computers. Mac OS User Interface solution offers you large quantity of Mac OS templates, samples and user interface design examples.Block Diagram Software
The popularity of Block Diagrams grows day by day. The existence of powerful software for their design is an excellent news! ConceptDraw DIAGRAM Block Diagram Software offers the Block Diagrams Solution from the "Diagrams" Area.When To Use a Fishbone Diagram
Well constructed Fishbone diagrams work for most entrepreneurs and almost any industry or person having a problem. Professional diagramming software may help you create Fishbone (Cause and Effect or Ishikawa) diagrams. When people are unclear about what is causing an issue, ConceptDraw DIAGRAM will be your lifesaver. When to use a Fishbone diagram? Originally developed as a quality control tool, you may find a Fishbone diagram helpful when used in many cases, such as to analyze a complex problem when there are many causes, for identifying all possible root causes for an effect or a problem, when you need different point of view to look on a problem, to uncover bottlenecks and identify where and why a process doesn't work, for acceleration a process when traditional ways of problem solving consume many time.
 Business Process Mapping
The Business Process Mapping solution has a collection of vector graphic libraries, pre-made templates, and examples of the business process maps. They are useful for many business specialists including economists, politicians, analysts, and other economic experts, officials and state managers for making the unique and professionally looking drawings. Use it to create an effective Business process map, SIPOC diagram, Swim lanes flowchart and clearly define the necessary business processes due to their inputs and outputs.
Cross-Functional Flowchart
Use of Cross-Functional Flowchart is a clear way of showing each team member’s responsibilities and how processes get shared or transferred between different responsible people, teams and departments. Use the best flowchart maker ConceptDraw DIAGRAM with a range of standardized cross-functional flowchart symbols to create the Cross-Functional Flowcharts simply and to visualize the relationship between a business process and the functional units responsible for that process. To draw the most quickly Cross-Functional Flowcharts, Cross Functional Process Maps, or Cross Functional Process Flow Diagrams, start with a Cross-functional flowchart samples and templates from ConceptDraw Solution Park. The ConceptDraw Arrows10 and RapidDraw technologies will be also useful for you in drawing. ConceptDraw DIAGRAM supports designing both types - horizontal and vertical Cross-functional flowcharts. A vertical layout makes the accents mainly on the functional units while a horizontal layout - on the process. If you need a Visio alternative in Mac OS X, try ConceptDraw DIAGRAM. Its interface is very intuitive and it’s actually much easier to use than Visio, yet somehow it’s just as powerful if not more so. ConceptDraw DIAGRAM performs professional quality work and seamless Visio interaction.
UML Flowchart Symbols
The UML diagram is a powerful tool which lets visually represent all system's components, the interactions between them and relationships with external user interface. The Rapid UML solution for ConceptDraw DIAGRAM software offers diversity of UML flowchart symbols for drawing all types of UML diagrams.Business Process Workflow Diagrams & Software
Business Process Workflow Diagram is a professional visual tool that is widely applied for business development, business analysis, business process optimization and documenting business processes. Business Process Workflow Diagram lets depict in details the steps of business processes and flow of tasks between them, the execution of business processes, transfer of data and documents. The workflows on the Business Process Workflow Diagram are represented using the set of common symbols which let easy illustrate business processes and process flows, depict the start, all major steps and end of the process, what data are used by the process, how the data flow through the business areas within scope of our project, how the tasks are executed and by who, and how workers interact with each other.
UML Tool & UML Diagram Examples
The Unified Modeling Language (abbr. UML) is a general-purpose modeling language widely used in the field of software development, software engineering, education, science, industry, business. In 1997 the UML was approved as a standard by the OMG (Object Management Group) and in 2005 was published as ISO standard by the International Organization for Standardization. UML is widely and succesfully applied for optimization the process of software systems development and business systems analysis. There are used 14 types of UML diagrams, 7 from them depict structural information, another 7 types represent different types of behavior and aspects of interactions. Design of any automated process is easy with ConceptDraw DIAGRAM and unique Rapid UML solution from the Software Development area, which provides numerous UML examples, templates and vector stencils libraries for drawing all types of UML 1.x and UML 2.x diagrams. Use of predesigned UML diagram examples and templates lets you quickly start drawing your own UML diagrams in ConceptDraw DIAGRAM software.
 Business Process Workflow Diagrams
The Business Process Workflow Diagrams solution was developed for a purpose of extending the ConceptDraw DIAGRAM software with the pre-made examples and templates of the workflow diagrams, and a library full of vector stencils, workflow chart elements, icons, arrows, connectors for making the needed drawings at an ease. Representing the documents, transferring data and tasks during the performance of the work process has become much simpler for many specialists. The list includes university professors, PhDs, postgraduates, postdocs, scientists, researchers, IT specialists, computer engineers, network and telecommunication engineers, software engineers, technical writers, system administrators, technical support specialists, IT managers, system architects and many other professions.
Project Timeline
Project timeline is a type of chart which allows visually represent the chronology of works for the project, placing the key points of the project (milestones) on a timescale. You need to make professional looking project timeline? Create it with ConceptDraw DIAGRAM ! ConceptDraw DIAGRAM extended with Timeline Diagrams Solution from the Management Area is the best timeline diagrams softwareElectrical Symbols — Switches and Relays
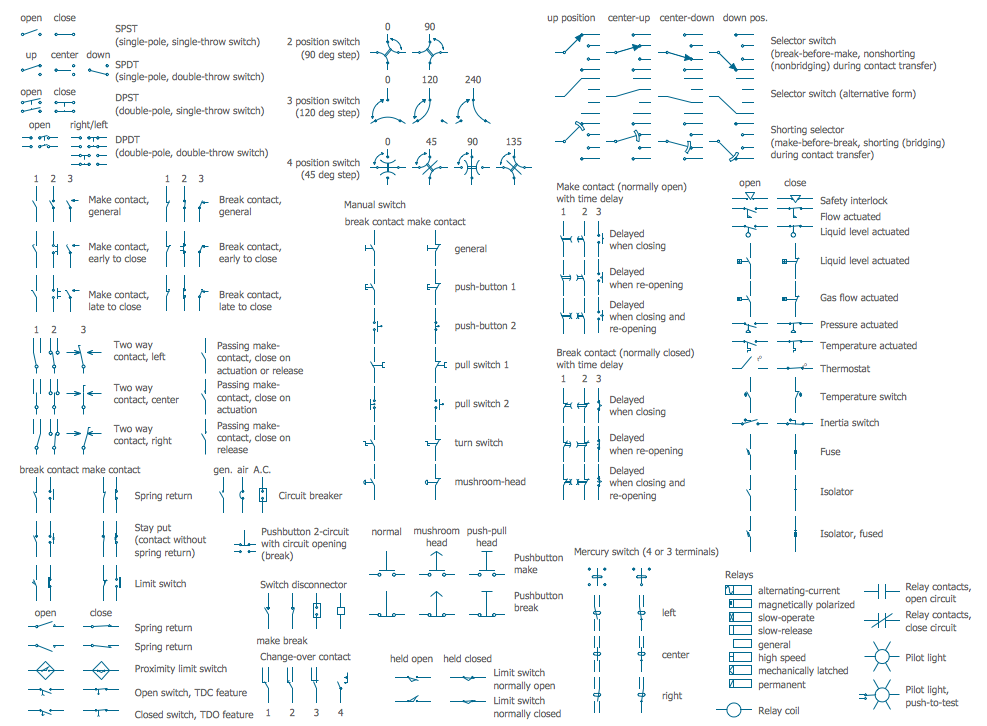
In electrical engineering, a switch is an electrical component that can break an electrical circuit, interrupting the current or diverting it from one conductor to another. The mechanism of a switch may be operated directly by a human operator to control a circuit (for example, a light switch or a keyboard button), may be operated by a moving object such as a door-operated switch, or may be operated by some sensing element for pressure, temperature or flow. A relay is a switch that is operated by electricity. Switches are made to handle a wide range of voltages and currents; very large switches may be used to isolate high-voltage circuits in electrical substations. 26 libraries of the Electrical Engineering Solution of ConceptDraw DIAGRAM make your electrical diagramming simple, efficient, and effective. You can simply and quickly drop the ready-to-use objects from libraries into your document to create the electrical diagram.Office Floor Plans
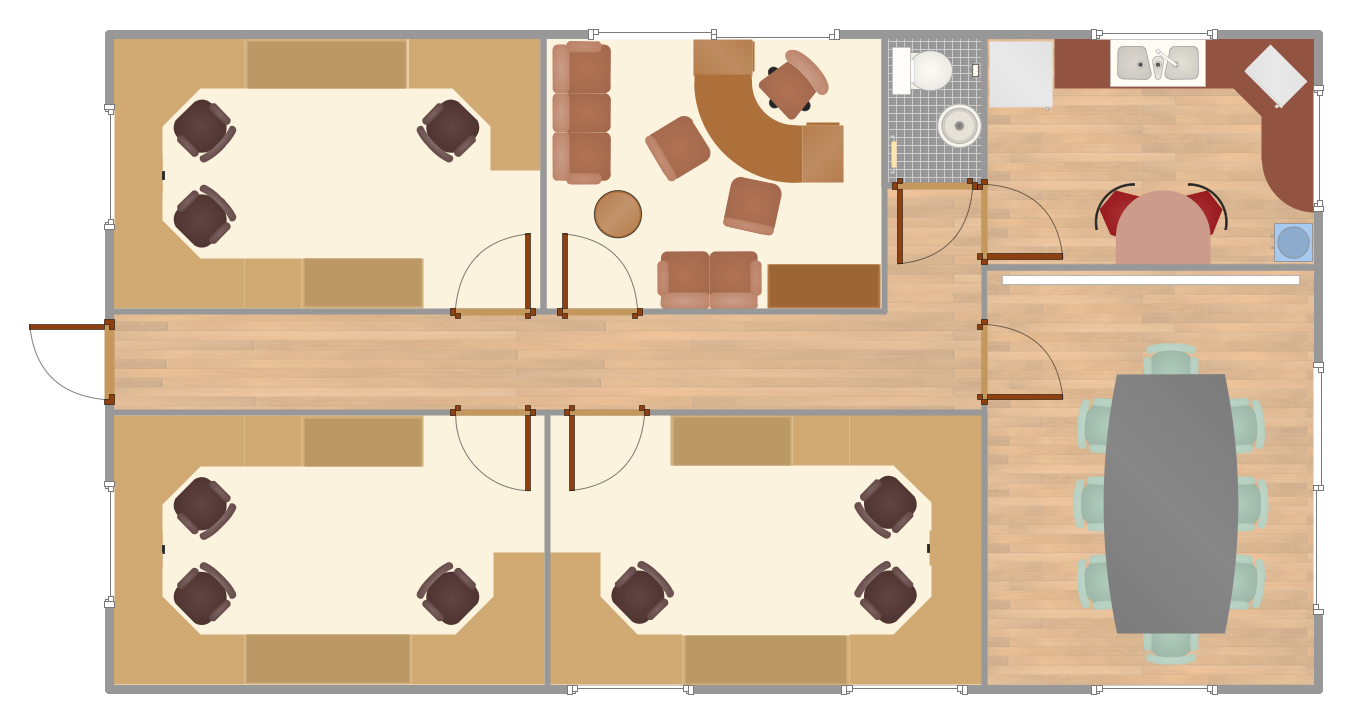
ConceptDraw DIAGRAM is a powerful diagramming and vector drawing software. Extended with Office Layout Plans Solution from the Building Plans Area, ConceptDraw DIAGRAM became the ideal software for making Office Floor Plans.
 Business Diagrams
The Business Diagrams Solution extends ConceptDraw DIAGRAM with an extensive collection of professionally designed illustrative samples and a wide variety of vector stencils libraries, which are the real help for all business-related people, business analysts, business managers, business advisers, marketing experts, PR managers, knowledge workers, scientists, and other stakeholders allowing them to design the bright, neat, expressive and attractive Bubble Diagrams, Circle-Spoke Diagrams, Circular Arrows Diagrams, and Venn Diagrams with different quantity of sets in just minutes; and then successfully use them in documents, reports, statistical summaries, and presentations of any style.
PDPC
ConceptDraw DIAGRAM extended with Seven Management and Planning Tools Solution from the Management Area of ConceptDraw Solution Park is the best software for drawing all types of diagrams from the Seven Management and Planning Tools: Affinity Diagram, Relations Diagram, Prioritization Matrix, Root Cause Analysis Tree Diagram, Involvement Matrix, PERT Chart, and Risk Diagram (PDPC).
 SYSML
SYSML
In order to make a SysML-related drawing, the ConceptDraw DIAGRAM charting and drawing software can be used. Also, the SysML solution can be found as an extension to the ConceptDraw DIAGRAM application, enabling all those with systems engineering background to use the offered tools for creating the needed systems process models in order to use in the professional documentation for either distribution or analysis. Offering the vector stencil libraries full of the icons that may relate to each of the 9 official diagrams used in SysML, the SysML solution is useful for many system engineers.
- Audit planning flowchart | Flowchart Off Page Reference Example
- Process Flow Chart Software Free | Svg Flow Chart
- Audit flowcharts - Vector stencils library | HR flowchart - Vector ...
- Decision Tree Analysis
- Decision tree | Root cause analysis tree diagram - Personal problem ...
- Lead to opportunity sales flow | Sales Process Flowchart Symbols ...
- Lead to opportunity sales flow | Audit planning flowchart | Business ...
- Decision tree | Cause and Effect Analysis | Influence Diagram ...
- Circular diagrams - Vector stencils library | Basic Flowchart Symbols ...
- Decision Making | Organization Chart Software: A Comprehensive ...


