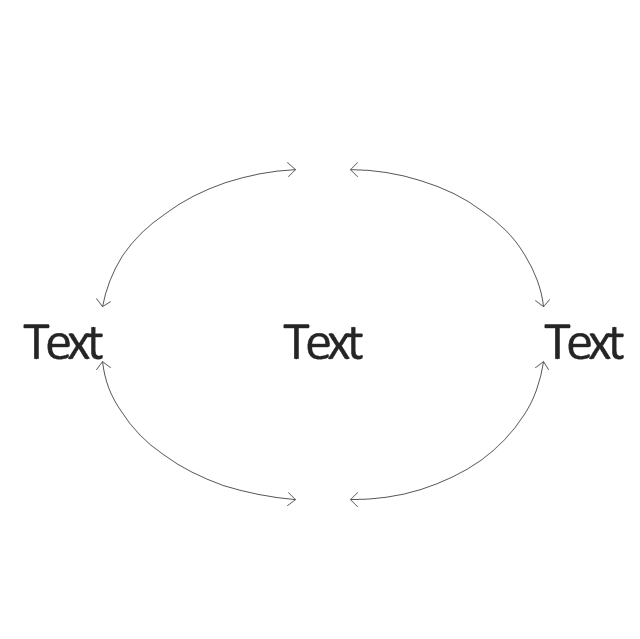
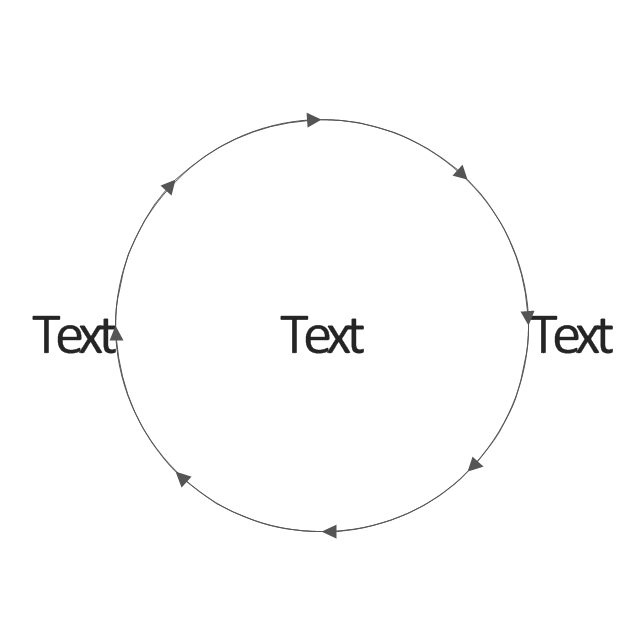
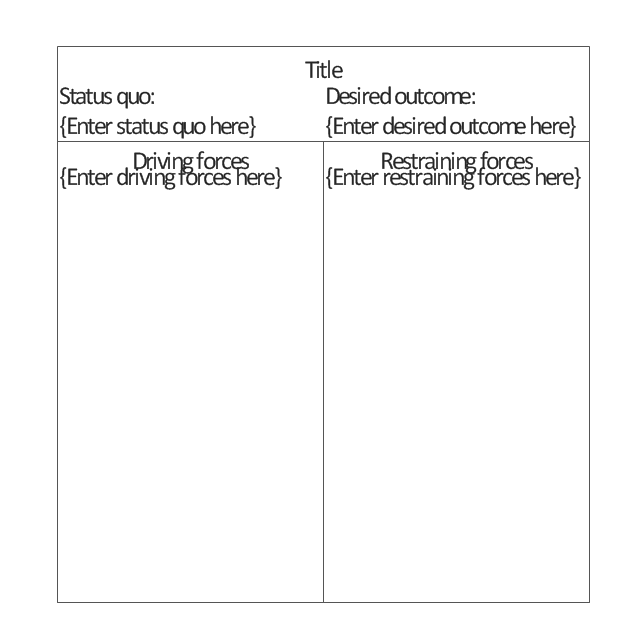
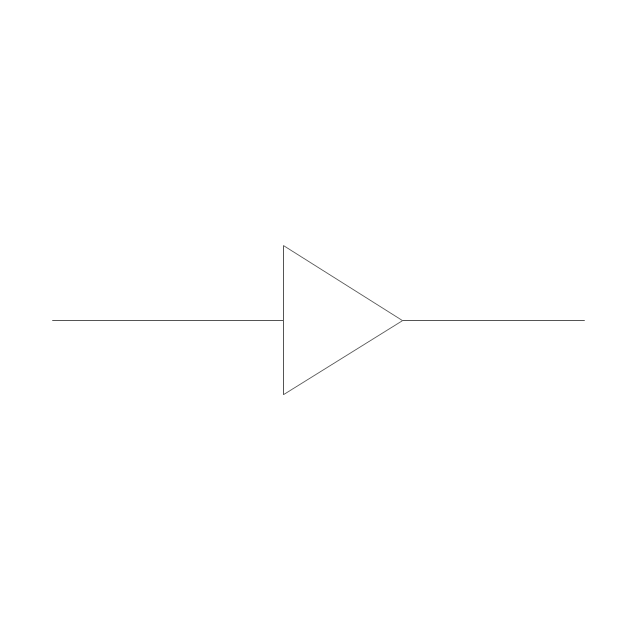
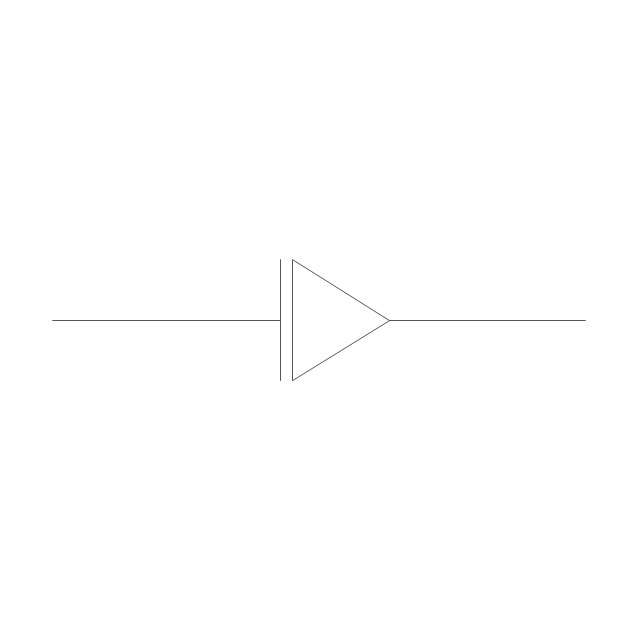
The vector stencils library "TQM diagrams" contains 58 TQM symbols. Use it in business process re-engineering, total quality management, continuous improvement, and quality solutions to draw cause-and-effect diagrams, top-down, and cross-functional process flow charts in the ConceptDraw PRO diagramming and vector drawing software extended with the Total Quality Management (TQM) Diagrams solution from the Quality area of ConceptDraw Solution Park.
Types of Flowcharts
A Flowchart is a graphical representation of process, algorithm, workflow or step-by-step solution of the problem. It shows the steps as boxes of various kinds and connects them by arrows in a defined order depicting a flow. There are twelve main Flowchart types: Basic Flowchart, Business Process Modeling Diagram (BPMN), Cross Functional Flowchart, Data Flow Diagram (DFD), IDEF (Integrated DEFinition) Flowchart, Event-driven Process Chain (EPC) Diagram, Influence Diagram (ID), Swimlane Flowchart, Process Flow Diagram (PFD), Specification and Description Language (SDL) Diagram, Value Stream Mapping, Workflow Diagram. Using the Flowcharts solution from the Diagrams area of ConceptDraw Solution Park you can easy and quickly design a Flowchart of any of these types. This solution offers a lot of special predesigned vector symbols for each of these widely used notations. They will make the drawing process of Flowcharts much easier than ever. Pay also attention for the included collection of ready Flowchart examples, samples and quick-start templates. This is business process improvement tools. If you are looking for MS Visio for your Mac, then you are out of luck, because it hasn't been released yet. However, you can use Visio alternatives that can successfully replace its functions. ConceptDraw DIAGRAM is an alternative to MS Visio for Mac that provides powerful features and intuitive user interface for the same.
"Classic TQM Tools ...
Flow Charts Pictures, symbols or text coupled with lines, arrows on lines show direction of flow. Flowcharting enables
modeling of processes; problems/ opportunities and decision points etc. It develops a common understanding of a process by those in
volved." [whaqualitycenter.org/ Portals/ 0/ Tools%20 to%20 Use/ Classic%20 Quality%20 Tools/ Classic%20 TQM%20 Tools%20 R%20 2-12.pdf]
The vector stencils library TQM diagrams contains 58 symbols for drawing total quality management (TQM) flow charts using the ConceptDraw PRO diagramming and vector drawing software.
The example "Design elements - TQM diagram" is included in the Total Quality Management (TQM) Diagrams solution from the Quality area of ConceptDraw Solution Park.
"There are two definitions for wireless LAN roaming:
Internal Roaming (1): The Mobile Station (MS) moves from one access point (AP) to another AP within a home network because the signal strength is too weak. An authentication server (RADIUS) performs the re-authentication of MS via 802.1x (e.g. with PEAP). The billing of QoS is in the home network. A Mobile Station roaming from one access point to another often interrupts the flow of data among the Mobile Station and an application connected to the network. The Mobile Station, for instance, periodically monitors the presence of alternative access points (ones that will provide a better connection). At some point, based on proprietary mechanisms, the Mobile Station decides to re-associate with an access point having a stronger wireless signal. The Mobile Station, however, may lose a connection with an access point before associating with another access point. In order to provide reliable connections with applications, the Mobile Station must generally include software that provides session persistence.
External Roaming (2): The MS (client) moves into a WLAN of another Wireless Internet Service Provider (WISP) and takes their services (Hotspot). The user can independently of his home network use another foreign network, if this is open for visitors. There must be special authentication and billing systems for mobile services in a foreign network." [Wireless LAN. Wikipedia]
This Cisco roaming wireless local area network diagram example was created using the ConceptDraw PRO diagramming and vector drawing software extended with the Cisco Network Diagrams solution from the Computer and Networks area of ConceptDraw Solution Park.
Used Solutions
- Interrupt Flowchart
- Simple Interrupt Processing Flow Chart
- Flow Chart Interrupt Symbol
- Flowchart Interrupt Process
- Types of Flowcharts | Simple Interrupt Processing
- TQM diagrams - Vector stencils library | Process Flowchart | Event ...
- Basic Flowchart Symbols and Meaning | Design elements - TQM ...
- TQM diagrams - Vector stencils library | Create TQM Flowcharts for ...
- TQM Diagram Tool | Process Flowchart | Business diagrams & Org ...
- Process Flowchart | TQM diagrams - Vector stencils library | Types of ...









-tqm-diagrams---vector-stencils-library.png--diagram-flowchart-example.png)
-tqm-diagrams---vector-stencils-library.png--diagram-flowchart-example.png)
-tqm-diagrams---vector-stencils-library.png--diagram-flowchart-example.png)
-tqm-diagrams---vector-stencils-library.png--diagram-flowchart-example.png)






-tqm-diagrams---vector-stencils-library.png--diagram-flowchart-example.png)


-tqm-diagrams---vector-stencils-library.png--diagram-flowchart-example.png)
-tqm-diagrams---vector-stencils-library.png--diagram-flowchart-example.png)
-tqm-diagrams---vector-stencils-library.png--diagram-flowchart-example.png)
-tqm-diagrams---vector-stencils-library.png--diagram-flowchart-example.png)
-tqm-diagrams---vector-stencils-library.png--diagram-flowchart-example.png)
-tqm-diagrams---vector-stencils-library.png--diagram-flowchart-example.png)
-tqm-diagrams---vector-stencils-library.png--diagram-flowchart-example.png)
-tqm-diagrams---vector-stencils-library.png--diagram-flowchart-example.png)
-tqm-diagrams---vector-stencils-library.png--diagram-flowchart-example.png)
-tqm-diagrams---vector-stencils-library.png--diagram-flowchart-example.png)
-tqm-diagrams---vector-stencils-library.png--diagram-flowchart-example.png)
-tqm-diagrams---vector-stencils-library.png--diagram-flowchart-example.png)
-tqm-diagrams---vector-stencils-library.png--diagram-flowchart-example.png)
