Types of Flowchart - Overview
When designing a process or an instruction in clear and understandable way, you should consider creating a flowchart. You can avoid spending a lot of time understanding complex concepts as they get clear with different diagrams. The flowcharts are very popular diagram type, they are useful at different fields from the description business processes to the presentation of cooking recipes. Basic Flowchart, Business Process Modeling Diagram, Process Flowchart, Cross Functional Flowchart, Procedure Flowchart, Data Flow Diagram, IDEF Flowchart, SDL Diagram, Workflow Diagram, Document Flowchart, Program Flowchart, Value Stream Map, System Flowchart, Highlight Flowchart, Sales Flowchart are the main types flowchart. The ConceptDraw PRO is one of the professional applications which has great advantages and using which you can create different types of Flowcharts easy and fast. Try to draw an illustrative and comprehensible diagram in ConceptDraw PRO describing the processes instead of writing complex long text and make sure how it is convenient. Visio is expensive, and if you use it in a team environment, these costs are compounded. ConceptDraw PRO is an affordable alternative to Visio and luckily, it comes with a team plan. ConceptDraw PRO can import and export Visio files, so Mac users can collaborate with PC users stuck on Microsoft's software.
UML Activity Diagram
UML Activity Diagram is a type of UML diagrams, which illustrates the business and operational step-by-step workflows of components within a system and shows the overall flow of control. UML Activity Diagram is constructed from a limited number of shapes, connected each other with arrows. The most important shape types are rounded rectangles, diamonds, bars, black circle, encircled black circle. The arrows represent the order in which activities happen and run from the start towards the end. ConceptDraw PRO software enhanced with Rapid UML solution is ideal for software designers and software developers who need to draw the UML Activity Diagrams and other types of UML diagrams. It is convenient to use the appropriate stencils of UML notation from the UML Activity library included to the Rapid UML solution of ConceptDraw Solution Park and containing a lot of specific vector UML objects. Use them to design your own UML Activity Diagrams, make them colorful and attractive with style tools of ConceptDraw PRO software.
 Accounting Flowcharts
Accounting Flowcharts solution extends ConceptDraw PRO software with templates, samples and library of vector stencils for drawing the accounting flow charts.
 ATM UML Diagrams
The ATM UML Diagrams solution lets you create ATM solutions and UML examples. Use ConceptDraw PRO as a UML diagram creator to visualize a banking system.
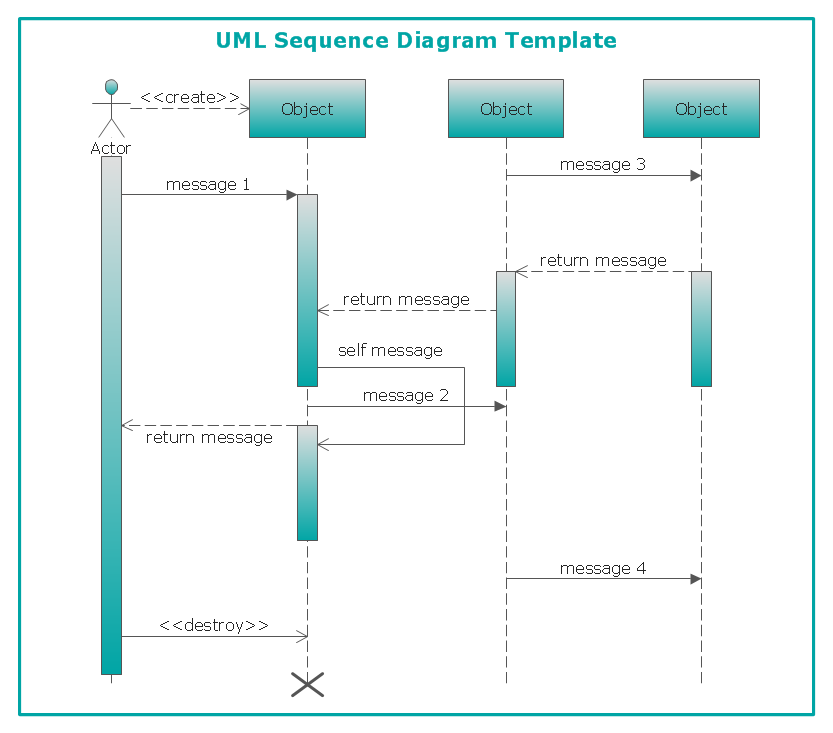
UML Sequence Diagram
UML Sequence Diagram can be created using ConceptDraw PRO diagramming software contains rich examples and template. ConceptDraw is perfect for software designers and software developers who need to draw UML Sequence Diagrams.
- Types of Flowchart - Overview | Accounting Flowcharts | UML Activity ...
- Types of Flowchart - Overview | UML Activity Diagram | Bank ...
- UML Activity Diagram | Types of Flowchart - Overview | Bank Auto ...
- Use Case Diagram Bank Loan System
- Accounting Flowcharts | Types of Flowchart - Overview | Bank Loan ...
- Types of Flowchart - Overview | UML Activity Diagram | UML ...
- Bank UML Diagram | UML Activity Diagram | Types of Flowchart ...
- UML Activity Diagram | Bank UML Diagram | Types of Flowchart ...
- Bank UML Diagram | UML Activity Diagram | UML Sequence ...
- Bank Loan Process Flow Diagram
- UML Activity Diagram | State Digram Of Bank Loan
- Sample Flow Chart Of A Loan Processing
- Diagram Showing Loan Process In A Bank
- Bank Loan System Usecase Class Diagrams
- Types of Flowchart - Overview | UML Activity Diagram | Auto Loan ...
- ATM UML Diagrams | Bank UML Diagram | UML Activity Diagram ...
- Diagram On How To Obtain Loan From Bank Using Flow Chart
- Types of Flowchart - Overview | Accounting Flowcharts | ATM UML ...
- Types of Flowchart - Overview | UML Sequence Diagram | Diagram ...
- Types of Flowchart - Overview | Accounting Flowcharts | ATM UML ...


