Basic Flowchart Symbols and Meaning
Flowcharts are the best for visually representation the business processes and the flow of a custom-order process through various departments within an organization. ConceptDraw PRO diagramming and vector drawing software extended with Flowcharts solution offers the full set of predesigned basic flowchart symbols which are gathered at two libraries: Flowchart and Flowcharts Rapid Draw. Among them are: process, terminator, decision, data, document, display, manual loop, and many other specific symbols. The meaning for each symbol offered by ConceptDraw gives the presentation about their proposed use in professional Flowcharts for business and technical processes, software algorithms, well-developed structures of web sites, Workflow diagrams, Process flow diagram and correlation in developing on-line instructional projects or business process system. Use of ready flow chart symbols in diagrams is incredibly useful - you need simply drag desired from the libraries to your document and arrange them in required order. There are a few serious alternatives to Visio for Mac, one of them is ConceptDraw PRO. It is one of the main contender with the most similar features and capabilities.
How to Make SWOT Analysis in a Word Document
A SWOT Analysis is a popular tool of the strategic planning which is used to evaluate the Strengths, Weaknesses, Opportunities, and Threats that are involved in any businesses. Use of mind maps allows you to collect a lot of information used for SWOT Analysis, visually structure it and also identify the relationships between different parts of this information. SWOT and TOWS Matrix Diagrams solution for ConceptDraw Solution Park combines professional visual advantages of ConceptDraw MINDMAP software and presentation capabilities of ConceptDraw PRO, which together provide a complete work solution. The SWOT and TOWS diagrams, matrices or mind maps produced in ConceptDraw PRO using the predesigned vector objects or filling the ready templates, can be then easily exported to Microsoft Word, Microsoft Visio, Microsoft PowerPoint, Adobe PDF, and many other electronic file formats. The possibility of export makes easy the use of SWOT diagrams designed in ConceptDraw PRO and lets you efficiently collaborate even with people who maybe don't have this software.HelpDesk
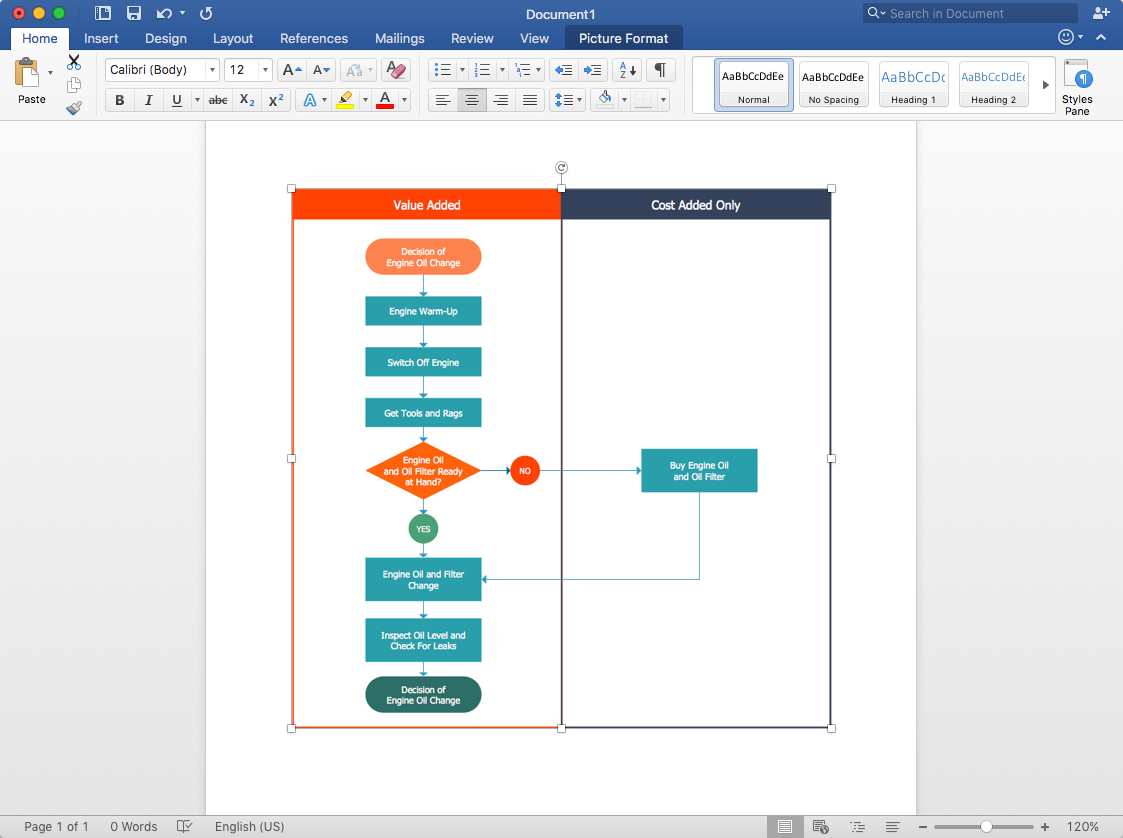
How to Add a Cross-Functional Flowchart to MS Word
ConceptDraw PRO allows you to easily create cross-functional flowcharts and then insert them into a MS Word document.HelpDesk
How to Use the MS Word Exchange Solution
ConceptDrwa MINDMAP gives you the ability to export your mind map into a ready-to-use Microsoft Word document.HelpDesk
How to Convert a Mind Map into MS Word Document
Mind maps are often used for structuring ideas, planning and organizing of various documents. ConceptDraw MINDMAP allows you transfer a mind map to MS Word format using its export facilities. You can convert a mind map to a MS Word outline using the set of standard templates, or even your custom template. Thus, your mind map will be transformed into the proper document format. Using a custom MS Word template allows you apply your individual style to each document, being exported from ConceptDraw MINDMAP. You can use a mind mapping to capture ideas and structure information. Then making a quick conversion to MS Word and you finally obtain a clean and stylish document.Venn Diagram Template for Word
This template shows the Venn Diagram. It was created in ConceptDraw PRO diagramming and vector drawing software using the ready-to-use objects from the Venn Diagrams Solution from the "Diagrams" area of ConceptDraw Solution Park.HelpDesk
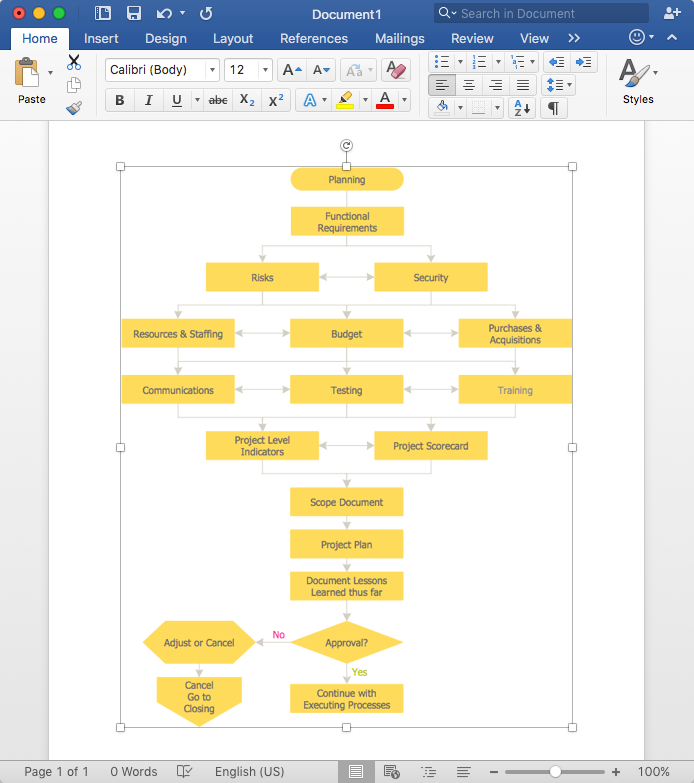
How to Add a Flowchart to MS Word Document
ConceptDraw PRO allows you to easily create flowcharts and then insert them into a MS Word document.Process Flowchart
The main reason of using Process Flowchart or PFD is to show relations between major parts of the system. Process Flowcharts are used in process engineering and chemical industry where there is a requirement of depicting relationships between major components only and not include minor parts. Process Flowcharts for single unit or multiple units differ in their structure and implementation. ConceptDraw PRO is Professional business process mapping software for making Process flowcharts, Process flow diagram, Workflow diagram, flowcharts and technical illustrations for business documents and also comprehensive visio for mac application. Easier define and document basic work and data flows, financial, production and quality management processes to increase efficiency of your business with ConcepDraw PRO. Business process mapping software with Flowchart Maker ConceptDraw PRO includes extensive drawing tools, rich examples and templates, process flowchart symbols and shape libraries, smart connectors that allow you create the flowcharts of complex processes, process flow diagrams, procedures and information exchange. Process Flowchart Solution is project management workflow tools which is part ConceptDraw Project marketing project management software. Drawing charts, diagrams, and network layouts has long been the monopoly of Microsoft Visio, making Mac users to struggle when needing such visio alternative like visio for mac, it requires only to view features, make a minor edit to, or print a diagram or chart. Thankfully to MS Visio alternative like ConceptDraw PRO software, this is cross-platform charting and business process management tool, now visio alternative for making sort of visio diagram is not a problem anymore however many people still name it business process visio tools.
HelpDesk
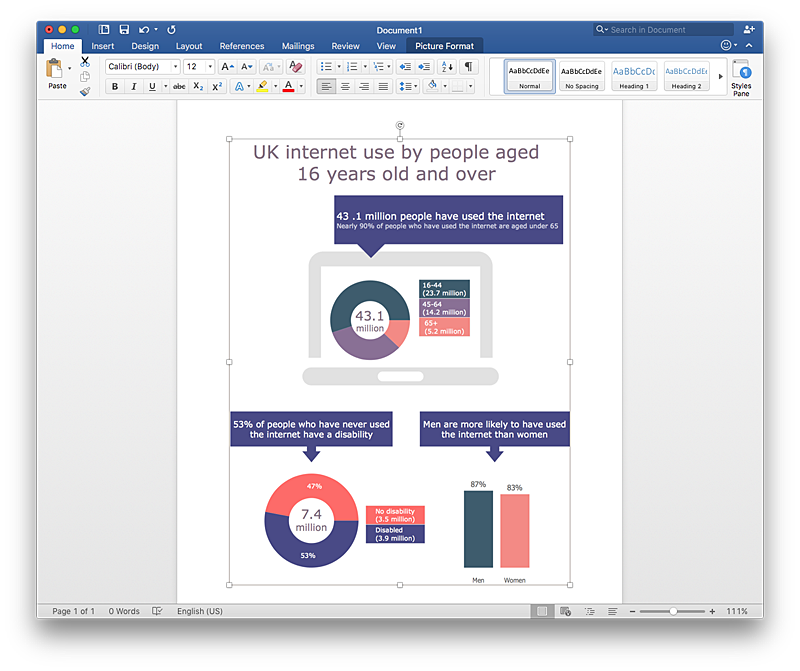
How to Add Data-driven Infographics to MS Word Document
Infographics ae usually used as an effective way of showing a certain portion of information . There are a wide of range of subjects that can be represented in a such way. One of the most simple usage for the infographics, in business diagrams. Sales staff can use it as an effective method of sharing the sales results with the entire team and stakeholders. ConceptDraw Data-driven Infographics solution gives all the tools one need to present a certain type of data. ConceptDraw PRO allows you to easily create data-driven infographics and then insert them into a MS Word document.
 Word Exchange
This solution extends ConceptDraw MINDMAP software with the ability to quickly create the framework for a future article or book, fill the structure with ideas, and use it to produce an MS Word document with just a simple click of the mouse.
HelpDesk
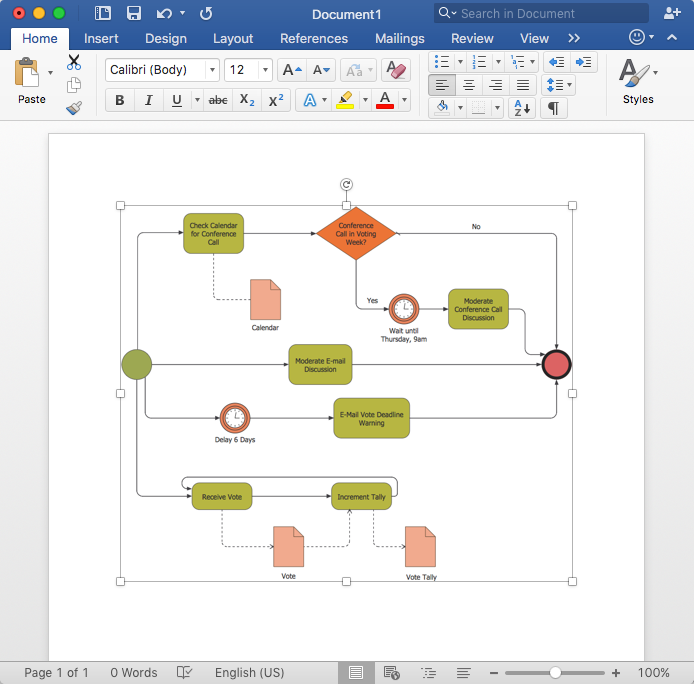
How to Add a Business Process Diagram to MS Word Document
ConceptDraw PRO allows you to easily create business process diagrams and then add them to a MS Word document.Pie Chart Word Template. Pie Chart Examples
The Pie Chart visualizes the data as the proportional parts of a whole and looks like a disk divided into sectors. The pie chart is type of graph, pie chart looks as circle devided into sectors. Pie Charts are widely used in the business, statistics, analytics, mass media. It’s very effective way of displaying relative sizes of parts, the proportion of the whole thing.Line Chart Template for Word
This sample was created in ConceptDraw PRO diagramming and vector drawing software using the Line Graphs Solution from Graphs and Charts area of ConceptDraw Solution Park. This sample shows the Line Chart of annual percentage change. The Line Chart allows you to clearly see the changes of data over the time.HelpDesk
How to Insert a Mind Map into Microsoft Word Document
ConceptDraw MINDMAP offers several options of converting your mind map to MS Word document. You can choose the proper format that meets your needs to communicate content of your mind maps. Generate text, presentations, images or web pages that are pertinent to your work. Primary, you can export a mind map to MS Word. This method allows stylizing the document by using a custom MS Word templates. If you need to combine text and hierarchically structured information in a single document, the best solution is to incorporate a mind map into the MS Word document using the copy-paste capabilities of ConceptDraw MINDMAP.HelpDesk
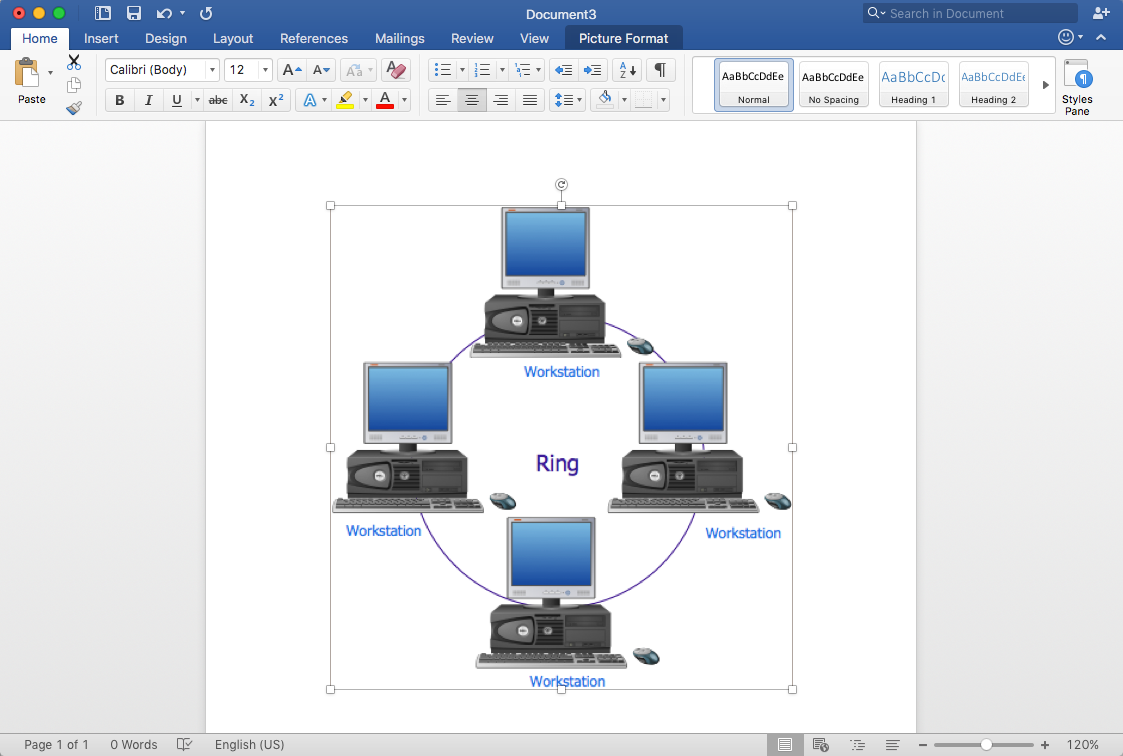
How to Add a Network Diagram to MS Word
Effective management of the computer network of any size includes the creation and maintenance of the network documentation package. Computer network diagrams may be the part of the network documentation that is often presented as MS Word document. Network diagrams describing the topology of the network and equipment installed in the network, are the essential part of this package. ConceptDraw PRO provides network administrators with ability to easily create computer network diagrams and then insert them into a MS Word document.- MS Word Function Flowchart
- Draw Flowcharts With Word And Powerpoint
- Free Flowchart Template For Word
- How to Add a Cross-Functional Flowchart to an MS Word Document ...
- Free Word Workflow Diagram Examples
- How to Add a Flowchart to a MS Word Document Using ...
- Word Exchange | How to Convert a Mind Map into MS Word ...
- How to Add a Cross-Functional Flowchart to an MS Word Document ...
- How to Add a Cross-Functional Flowchart to an MS Word Document ...
- Flowcharts in Word | How to Add a Cross-Functional Flowchart to an ...
- How to Add a Flowchart to a MS Word Document Using ...
- How to Add a Cross-Functional Flowchart to an MS Word Document ...
- Flowchart Software | Pie Chart Word Template . Pie Chart Examples ...
- How to Add a Workflow Diagram to a MS Word Document Using ...
- How to Insert a Mind Map into Microsoft Word Document | Flowchart ...
- How to Add a Business Process Diagram to a MS Word Document ...
- How to Use the MS Word Exchange Solution | Workflow Diagram ...
- How to Add a Business Process Diagram to a MS Word Document ...
- How to Add a Business Process Diagram to a MS Word Document ...
- Value Stream Mapping Microsoft Word Template


