Basic Flowchart Symbols and Meaning


Flowchart design. Flowchart symbols, shapes, stencils and icons


"In mathematics and computer science, an algorithm ... is a step-by-step procedure for calculations. Algorithms are used for calculation, data processing, and automated reasoning.
An algorithm is an effective method expressed as a finite list of well-defined instructions for calculating a function. Starting from an initial state and initial input (perhaps empty), the instructions describe a computation that, when executed, proceeds through a finite number of well-defined successive states, eventually producing "output" and terminating at a final ending state. The transition from one state to the next is not necessarily deterministic; some algorithms, known as randomized algorithms, incorporate random input." [Algorithm. Wikipedia]
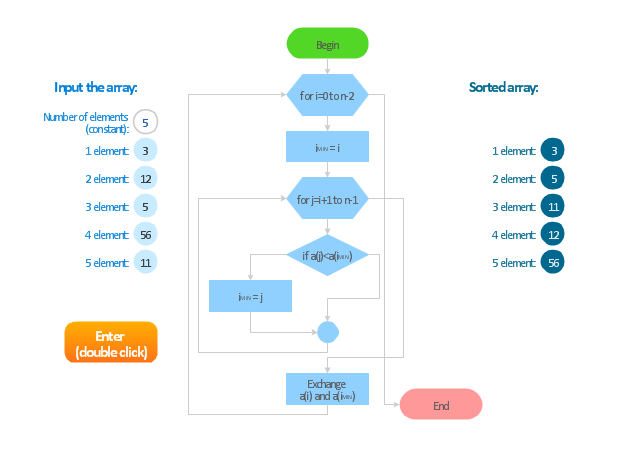
The algorithm flow chart example "Selection sorting method" was created using the ConceptDraw PRO diagramming and vector drawing software extended with the Flowcharts solution from the area "What is a Diagram" of ConceptDraw Solution Park.
An algorithm is an effective method expressed as a finite list of well-defined instructions for calculating a function. Starting from an initial state and initial input (perhaps empty), the instructions describe a computation that, when executed, proceeds through a finite number of well-defined successive states, eventually producing "output" and terminating at a final ending state. The transition from one state to the next is not necessarily deterministic; some algorithms, known as randomized algorithms, incorporate random input." [Algorithm. Wikipedia]
The algorithm flow chart example "Selection sorting method" was created using the ConceptDraw PRO diagramming and vector drawing software extended with the Flowcharts solution from the area "What is a Diagram" of ConceptDraw Solution Park.
Flowchart - Selection sorting method
Flowchart Marketing Process. Flowchart Examples

"An invoice, bill or tab is a commercial document issued by a seller to a buyer, relating to a sale transaction and indicating the products, quantities, and agreed prices for products or services the seller has provided the buyer.
Payment terms are usually stated on the invoice. These may specify that the buyer has a maximum number of days in which to pay, and is sometimes offered a discount if paid before the due date. The buyer could have already paid for the products or services listed on the invoice.
In the rental industry, an invoice must include a specific reference to the duration of the time being billed, so in addition to quantity, price and discount the invoicing amount is also based on duration. Generally each line of a rental invoice will refer to the actual hours, days, weeks, months, etc., being billed.
From the point of view of a seller, an invoice is a sales invoice. From the point of view of a buyer, an invoice is a purchase invoice. The document indicates the buyer and seller, but the term invoice indicates money is owed or owing. ...
Payment of invoices.
Organizations purchasing goods and services usually have a process in place for approving payment of invoices based on an employee's confirmation that the goods or services have been received.
Typically, when paying an invoice, a remittance advice will be sent to the supplier to inform them their invoice has been paid." [Invoice. Wikipedia]
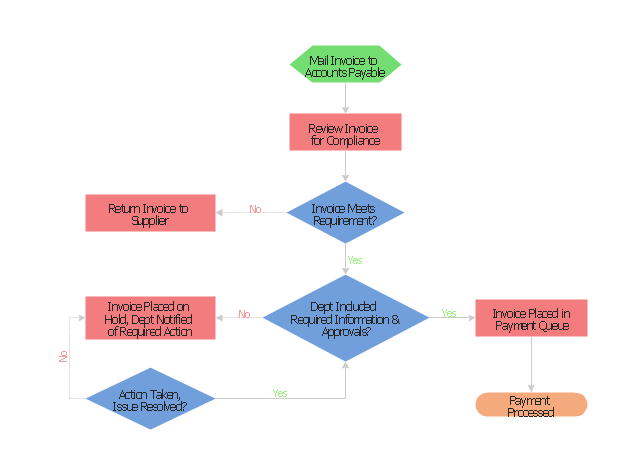
The flow chart example "Invoice payment process" was created using the ConceptDraw PRO diagramming and vector drawing software extended with the Flowcharts solution from the area "What is a Diagram" of ConceptDraw Solution Park.
Payment terms are usually stated on the invoice. These may specify that the buyer has a maximum number of days in which to pay, and is sometimes offered a discount if paid before the due date. The buyer could have already paid for the products or services listed on the invoice.
In the rental industry, an invoice must include a specific reference to the duration of the time being billed, so in addition to quantity, price and discount the invoicing amount is also based on duration. Generally each line of a rental invoice will refer to the actual hours, days, weeks, months, etc., being billed.
From the point of view of a seller, an invoice is a sales invoice. From the point of view of a buyer, an invoice is a purchase invoice. The document indicates the buyer and seller, but the term invoice indicates money is owed or owing. ...
Payment of invoices.
Organizations purchasing goods and services usually have a process in place for approving payment of invoices based on an employee's confirmation that the goods or services have been received.
Typically, when paying an invoice, a remittance advice will be sent to the supplier to inform them their invoice has been paid." [Invoice. Wikipedia]
The flow chart example "Invoice payment process" was created using the ConceptDraw PRO diagramming and vector drawing software extended with the Flowcharts solution from the area "What is a Diagram" of ConceptDraw Solution Park.
Flowchart - Invoice payment process
Sales Process Flowchart. Flowchart Examples

Business Process Flowchart Symbols

Types of Welding in Flowchart

 Business Process Diagrams
Business Process Diagrams solution extends the ConceptDraw DIAGRAM BPM software with RapidDraw interface, templates, samples and numerous libraries based on the BPMN 1.2 and BPMN 2.0 standards, which give you the possibility to visualize equally easy simple and complex processes, to design business models, to quickly develop and document in details any business processes on the stages of project’s planning and implementation.
 Business Process Mapping
The Business Process Mapping solution for ConceptDraw DIAGRAM is for users involved in process mapping and creating SIPOC diagrams.
- Talent management process | Human Resource Management ...
- Audit process flowchart (multipage) | How to Create a Scatter Chart ...
- Audit Flowcharts | Basic Audit Flowchart . Flowchart Examples | Audit ...
- Invoice payment process - Flowchart | Flowchart Payment Procedure
- Invoice payment process - Flowchart | Accounting Flowchart ...
- Audit Procedures | Audit Steps | Audit Flowchart Symbols | Audit ...
- Audit Flowcharts | Audit process flowchart (multipage) | Types of ...
- Recruitment | Flowchart Components | Hiring process workflow ...
- Flow chart Example. Warehouse Flowchart | Pie Charts | Seven ...
- Basic Flowchart Symbols and Meaning | Process Flowchart ...