Process Flowchart
The main reason of using Process Flowchart or PFD is to show relations between major parts of the system. Process Flowcharts are used in process engineering and chemical industry where there is a requirement of depicting relationships between major components only and not include minor parts. Process Flowcharts for single unit or multiple units differ in their structure and implementation. ConceptDraw PRO is Professional business process mapping software for making Process flowcharts, Process flow diagram, Workflow diagram, flowcharts and technical illustrations for business documents and also comprehensive visio for mac application. Easier define and document basic work and data flows, financial, production and quality management processes to increase efficiency of your business with ConcepDraw PRO. Business process mapping software with Flowchart Maker ConceptDraw PRO includes extensive drawing tools, rich examples and templates, process flowchart symbols and shape libraries, smart connectors that allow you create the flowcharts of complex processes, process flow diagrams, procedures and information exchange. Process Flowchart Solution is project management workflow tools which is part ConceptDraw Project marketing project management software. Drawing charts, diagrams, and network layouts has long been the monopoly of Microsoft Visio, making Mac users to struggle when needing such visio alternative like visio for mac, it requires only to view features, make a minor edit to, or print a diagram or chart. Thankfully to MS Visio alternative like ConceptDraw PRO software, this is cross-platform charting and business process management tool, now visio alternative for making sort of visio diagram is not a problem anymore however many people still name it business process visio tools.
Flow chart Example. Warehouse Flowchart
Warehouse Flowcharts are various diagrams that describe the warehousing and inventory management processes on the warehouses. Typical purposes of Warehouse Flowcharts are evaluating warehouse performance, measuring efficiency of customer service and organizational performance. This type of Workflow diagrams can be used for identifying any disconnection between business activities and business objectives. They are effectively used by warehouse-related people and organizations, manufacturers, wholesalers, exporters, importers, transporters, and others. Standard Warehousing process flow diagram and standard Workflow diagram are used for process identification for further evaluating effectiveness and profitability of overall business process. Use the ConceptDraw PRO vector graphic software extended with Flowcharts solution to design your own professional-looking Workflow diagrams and Flowcharts of any types, including the Warehouse flowchart, Process flow diagrams which depict in details all steps of Warehouse packages flow. Microsoft Visio, designed for Windows users, can’t be opened directly on Mac. But fortunately, there are several Visio alternatives for Mac which will help Mac users to work Visio files. With ConceptDraw PRO, you may open, edit and save files in Visio format.
Value Stream Mapping Symbols
VSM symbols are the best for a production process designing. The entire Value Stream Mapping method uses a graphical representation of the manufacturing process, factors' pros and cons, that all stakeholders can easily understand. Value Stream Mapping is a graphical technique that provides possibilities to improve analysis of a manufacturing process, at the stage of the transferring information or materials that required to deliver a product or service to the customer.Value stream with ConceptDraw PRO
The Value stream is a totality of all actions on the projection, order composition and production: starting from creation a product project to launching this product, from order to delivery, from extraction of raw materials to ready product manufacturing. Value stream mapping is a process of visualization of these actions and creation of a detailed and graphical map.Cross-Functional Flowchart (Swim Lanes)
Cross-Functional Flowchart is a type of chart which shows the series of process steps connected by the arrows to depict their order and applies the swim lanes to provide an extra dimension with means of assigning each process step to certain category. Often the category or the functional unit is a stakeholder (department, person, role), resource, project, phase, or any other attribute. Cross-Functional Flowcharts visually illustrate relationships between the business processes and the functional units responsible for this processes. ConceptDraw PRO is a powerful diagramming and vector drawing software for professional design Cross-Functional Flowcharts using the common notation of shapes and swim lanes. Cross-Functional Flowcharts solution included to the Business Processes area of ConceptDraw Solution Park provides numerous well-designed vector objects and connector tools for quick, easy and effective organizing information, representing process flows and relationships, and drawing Cross-Functional Flowcharts for business, science, education, technology, etc.Definition TQM Diagram
The Total Quality Management Diagram solution helps your organization visualize business and industrial processes. Create Total Quality Management diagrams for business process with ConceptDraw software.Double-headed Cross Functional Flowchart
ConceptDraw PRO is a powerful tool that helps you create a Cross Functional Flow Chart quickly and easily. Fine-tuning the objects in ConceptDraw PRO allows you to create a really professional finished article. ConceptDraw Arrows10 Technology gives drawing connectors a smart behavior that provides quick and precise placement, allows for easy changes and automatic rearrangement.Diagramming Software for Design UML Collaboration Diagrams
ConceptDraw helps you to start designing your own UML Collaboration Diagrams with examples and templates.
Illustrate the Computer Network of a Building
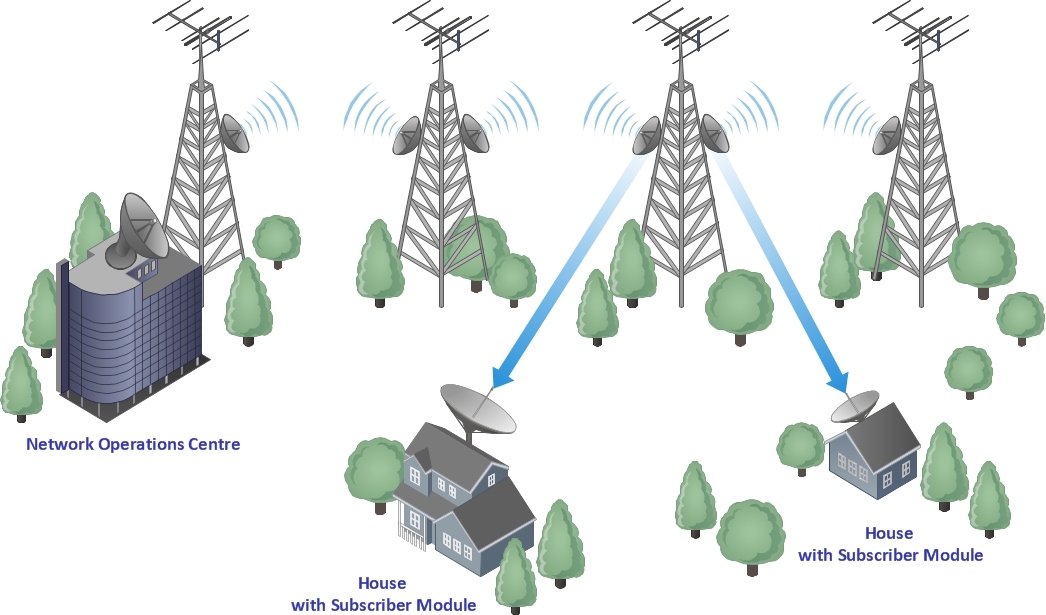
With best content of the Wireless Network solution that includes more than 10 building pre-designed objects network engineers can illustrate the computer network of a building.Network Diagram Software Enterprise Private Network
ConceptDraw - Perfect Network Diagramming Software with abundant examples and templates. ConceptDraw Network Diagram is ideal for network engineers and network designers who need to draw Enterprise Private Network diagrams.
Powerful Drawing Feature for Creating Professional Diagrams
This will let you create professional diagrams and charts using its simple RapidDraw option just in clicks. Take a look on a diagram you are looking for and create it fast and quickly.Quality Project Management with Mind Maps
The visual form of mind maps is helpful in all stages of quality management, from describing problem to describing and documenting a decision.Information Technology Architecture
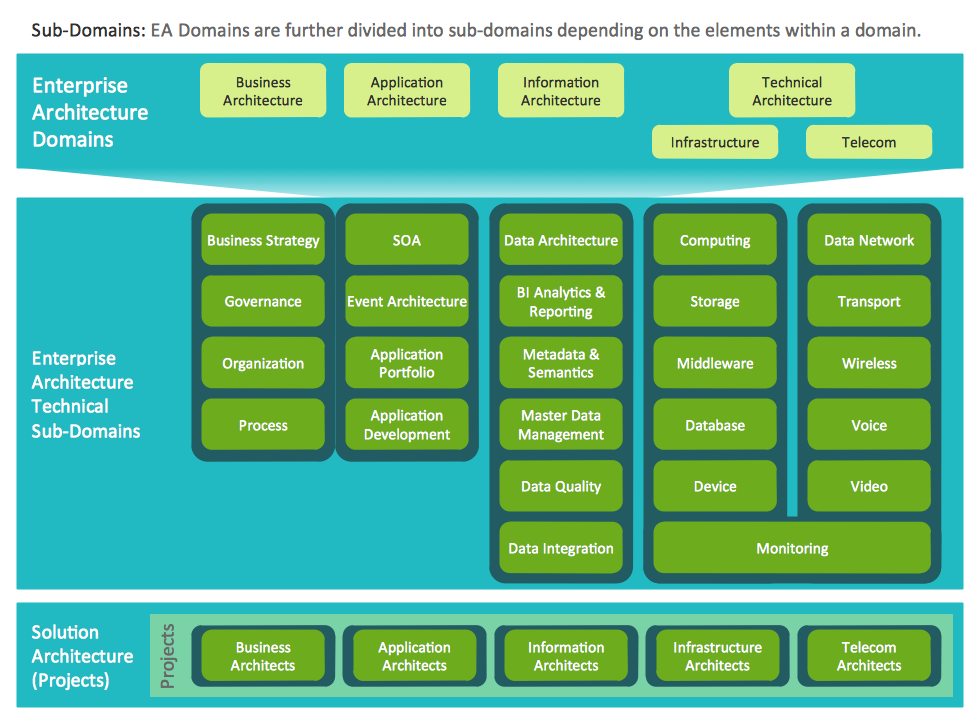
ConceptDraw PRO extended with Enterprise Architecture Diagrams Solution from the Management Area is a powerful software which provides a set of helpful tools for designing Information Technology Architecture.Tree Network Topology Diagram
A Tree network topology (Hierarchical topology) is a hybrid network topology that contains the combination of two or more star networks connected via bus networks. Each star network is a LAN (local area network) with central computer or server and workstation nodes connected to it. The central computers of star networks are connected to a main cable that is called a bus. Each node of the Tree network can have an arbitrary number of child nodes, you can easy add/remove the separate workstations and even the whole star networks, the failure of one workstation will not affect the work of others. This topology is ideal solution when workstations are located in groups within a small physical region, rarely is used in WAN configurations. Computer and Networks solution from Computer and Networks area of ConceptDraw Solution Park contains templates, samples and numerous libraries of predesigned vector stencils of computer network devices and equipment, which can be effectively used for designing various network topologies diagrams, including Tree Network Topology.ConceptDraw Arrows10 Technology
Connecting objects manually in ConceptDraw PRO is a snap: - points; - Connecting groups of objects; - Auto-routing; - Connectors text; - Snap to Guides ; - Quick.- Supermarket Logistics Flowchart
- Supermarket Management System Flowchart
- Draw Flowchart For A Supermarket
- Process Flowchart | Site Plans | Supermarket Entity Er Diagram
- Process Flowchart | ConceptDraw Solution Park | Site Plans | Dfd ...
- Value Stream Mapping Symbols | Process Flowchart | Site Plans ...
- Flowchart Supermarket Hypermart
- Flow chart Example. Warehouse Flowchart | Organogram Of A ...
- Process Flowchart | How to Create Flowcharts for an Accounting ...
- Process Flowchart | ConceptDraw Solution Park | Enterprise ...
- Supermarket Sales Flowcharts
- Supermarket System Flowchart
- Supermarket parking | Site Plans | Process Flowchart | Supermarket ...
- Flowchart Of Supermarket Billing
- Process Flowchart | TQM Diagram Tool | Erd For Supermarket System
- Supermarket parking | Site Plans | Process Flowchart | Site ...
- Flowchart Of Supermarket Billing System
- Supermarket Items Representation On Floor Plan
- Customer Payment Flow Chart In A Supermarket
- Process Flowchart | Value Stream Mapping Symbols | Landscape ...


