Basic Flowchart Symbols and Meaning
Flowcharts are the best for visually representation the business processes and the flow of a custom-order process through various departments within an organization. ConceptDraw PRO diagramming and vector drawing software extended with Flowcharts solution offers the full set of predesigned basic flowchart symbols which are gathered at two libraries: Flowchart and Flowcharts Rapid Draw. Among them are: process, terminator, decision, data, document, display, manual loop, and many other specific symbols. The meaning for each symbol offered by ConceptDraw gives the presentation about their proposed use in professional Flowcharts for business and technical processes, software algorithms, well-developed structures of web sites, Workflow diagrams, Process flow diagram and correlation in developing on-line instructional projects or business process system. Use of ready flow chart symbols in diagrams is incredibly useful - you need simply drag desired from the libraries to your document and arrange them in required order. There are a few serious alternatives to Visio for Mac, one of them is ConceptDraw PRO. It is one of the main contender with the most similar features and capabilities.
HelpDesk
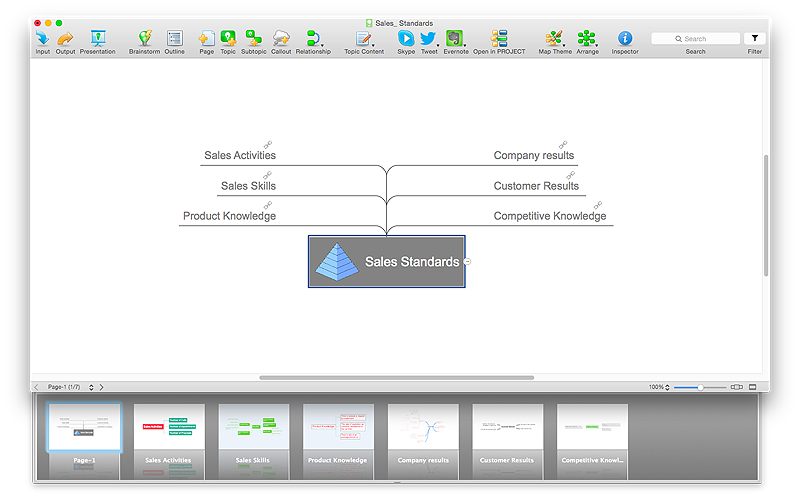
How to Split a Complex Map to a Few Simple Maps
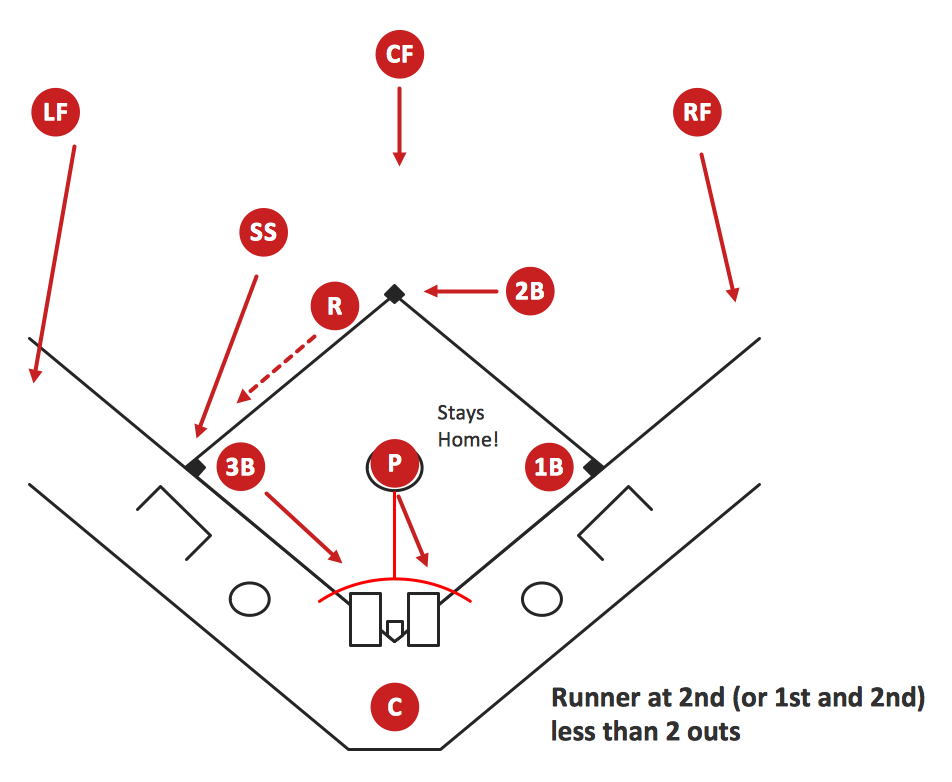
When using ConceptDraw MINDMAP, you can move each main topic of a large complex mind map to a separate page. Here is the instructions on how to create a multiple page mind map from a solid map.Baseball Diagram – Basic Bunt Coverage – Runner at 2nd
Drawing baseball diagrams using ConceptDraw PRO software extended with the Baseball solution saves your time, and adds more value to your work. You can easily convert vector drawing to a popular graphic format and then post it to your blog or site. There is no problem to add your logo or text copyright, or use some text comments to make your diagrams unique and recognizable.HelpDesk
How to Create a Fault Tree Analysis Diagram (FTD) in ConceptDraw PRO
Fault Tree Diagram are logic diagram that shows the state of an entire system in a relationship of the conditions of its elements. Fault Tree Diagram are used to analyze the probability of functional system failures and safety accidents. ConceptDraw PRO allows you to create professional Fault Tree Diagrams using the basic FTD symbols. An FTD visualize a model of the processes within a system that can lead to the unlikely event. A fault tree diagrams are created using standard logic symbols . The basic elements in a fault tree diagram are gates and events.HelpDesk
How to Create a Release Burn-Down Chart Using ConceptDraw PRO
The Agile methodology provides project teams the ability to quickly adapt the project to the current situation and thus achieve maximum productivity. According the Scrum method the steps needed to fulfill the project goal breaks down by using short sprints or iterations. The iterations together with an extensive collaboration can increase productivity by better understanding the entire flow of a project. A release burn-down chart is used to track a progress on a Scrum project. The ConceptDraw Scrum Workflow Solution makes it easy for Agile project team to build any professional Scrum diagram such as a Release velocity chart, Release burn-down chart, Sprint burn-down chart, or a Team velocity chart.Garrett IA Diagrams with ConceptDraw PRO
Garrett IA diagrams are used at development of Internet-resources, in particulars at projecting of interactions of web-resource elements. The diagram of information architecture of the web resource which is constructed correctly with necessary details presents to developers the resource in comprehensible and visual way.Banquet Hall Plan Software
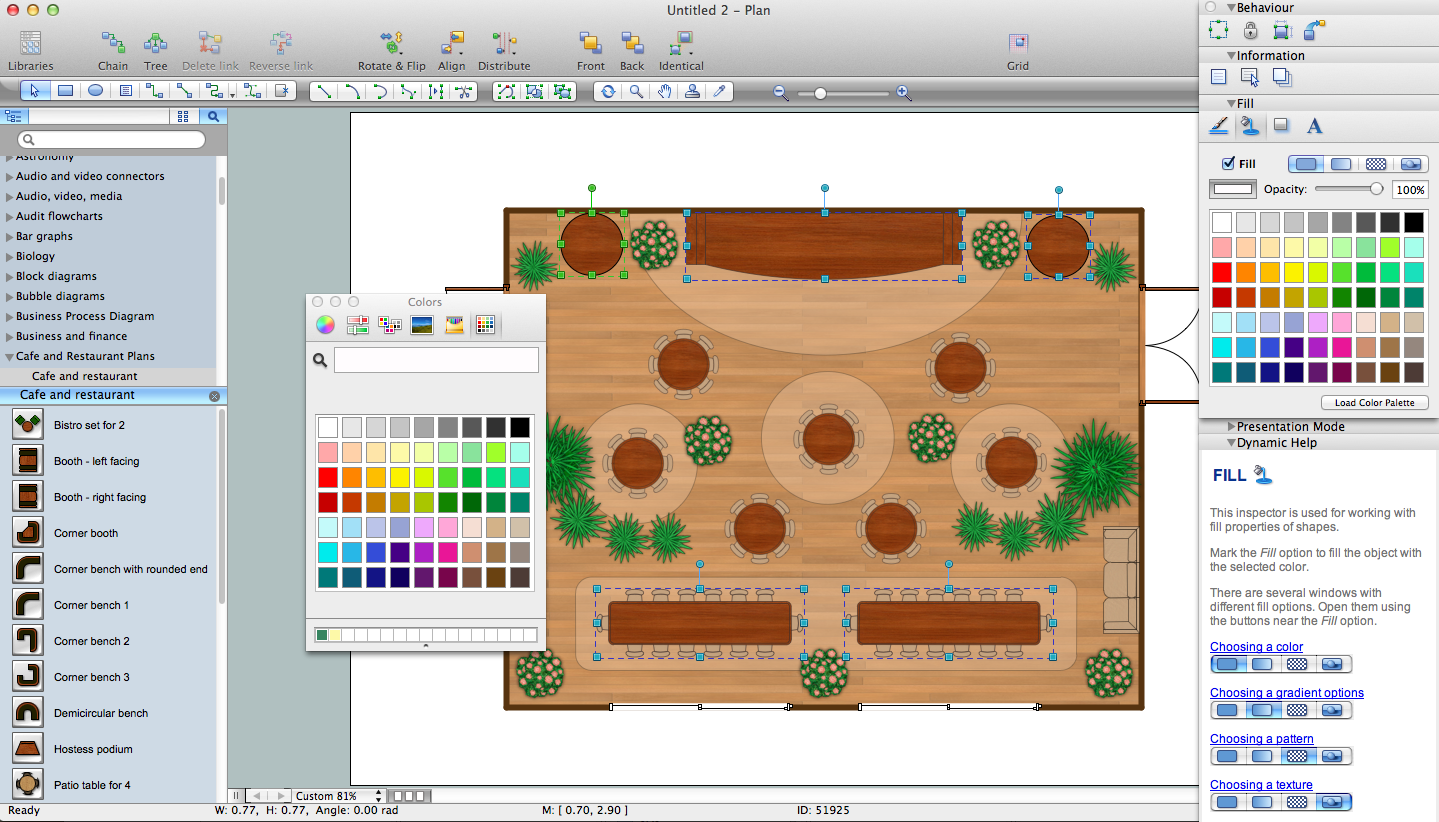
Our life is filled with a huge number of lucky events. Many of them are the reasons for organizing the celebration, feast, party or banquet. These events include of course weddings, birthdays, meetings with friends, themed parties, corporate events, and others. The main component of successful organization and banquet holding is its correct planning considering of all nuances and specifics of given event. You need compose the list of guests, determine a budget, select a suitable location for organizing event, determine its format - a traditional reception or buffet, consider menu and interesting entertainment program. A correct selection of banquet hall is one of the most important component of success. All details are important - location, reviews, hall size, interior, design, lighting, landscape design of surrounding territory. ConceptDraw PRO software extended with Cafe and Restaurant Floor Plan solution from Building Plans Area will help you ideally plan your banquet, create the plan of banquet hall and guests seating chart, and even design and construct new banquet hall.
 Health Food
The Health Food solution contains the set of professionally designed samples and large collection of vector graphic libraries of healthy foods symbols of fruits, vegetables, herbs, nuts, beans, seafood, meat, dairy foods, drinks, which give powerful possi
 Rapid UML
Rapid UML solution extends ConceptDraw PRO software with templates, samples and libraries of vector stencils for quick drawing the UML diagrams using Rapid Draw technology.
 Rapid UML
Rapid UML solution extends ConceptDraw PRO software with templates, samples and libraries of vector stencils for quick drawing the UML diagrams using Rapid Draw technology.
TQM Diagram Tool
The Total Quality Management Diagram solution helps you and your organization visualize business and industrial processes. Create Total Quality Management diagrams for business process with ConceptDraw software.Use a Fishbone Diagram to Attack Complex Problems
Any project is a complex system which rarely goes without some problems, even the most minor. But the success of the project mostly depends from the ability effectively solve appearing problems. There are many methods for problem solving, one of the most effective is the use a Fishbone diagram to attack complex problems. Use ConceptDraw PRO diagramming software with Fishbone Diagrams Solution to attack any complex problems with fishbone diagrams graphic method. Construct Fishbone diagram to help users brainstorm and break down a complex problem.How Do Fishbone Diagrams Solve Manufacturing Problems
How do Fishbone diagrams solve manufacturing problems? Fishbone diagrams are successfully used in various fields of industries and manufacturing to analyze the set of possible causes and their effects. Fishbone diagram provides a process to clearly define the “Effect” and then puts you to thinking about the possible causes, based on the categories of common problems in manufacturing. ConceptDraw PRO application extended with Fishbone Diagrams solution lets you construct Fishbone diagrams and represent globally recognized standards for manufacturing 6 Ms and 8 Ms.- Basic Flowchart Symbols and Meaning | Switches and relays ...
- Basic Flowchart Symbols and Meaning | Accounting Flowchart ...
- Basic Flowchart Symbols and Meaning | Electrical Symbols ...
- Cross-Functional Flowchart (Swim Lanes) | Swim Lane Diagrams ...
- Basic Flowchart Symbols and Meaning | Cross-functional flowcharts ...
- Basic Flowchart Symbols and Meaning | Electrical Symbols ...
- Flow Chart Symbol Used To Represent Action In Progress
- Bpmn Event Symbols
- Basic Flowchart Symbols and Meaning | Process Flowchart ...
- Bpmn 2 0 Symbols
- Basic Flowchart Symbols and Meaning | Sales arrows - Vector ...
- Basic Flowchart Symbols and Meaning | Data Flow Diagram ...
- Expanded objects BPMN 1.2 - Vector stencils library | Vector stencils ...
- How to Connect Objects in ConceptDraw PRO on PC | How to Set ...
- HR professions - Vector stencils library | Basic Flowchart Symbols ...
- The Means to Respond to Social Media Mentions | Bank Customer ...
- Weatherproof Lamp Switch Symbol
- Digital unit ventilator control - HVAC plan | Interior Design Site Plan ...
- Pie Chart Examples and Templates | Pie Chart Software ...
- Credit Card Processing System UML Diagram | Credit Card Order ...


