HelpDesk
How to Simplify Flow Charting on Mac
A flowchart is a great way to present any complex process in a simple to understand manner. A flowchart is perhaps the most common form of diagrams used in both technical and social fields. Since a flowchart is a method that allows describing visually any consequent process, it can be used to show the flow of logic of any process. In ConceptDraw DIAGRAM it really is simple to draw even the most complex flowcharts. Use RapidDraw technology for the best results.HelpDesk
How to Simplify Flow Charting on PC
Flowcharts are the best tool for staking out a huge and complex process into some small readable parts. The use of standard symbols that make it clear for a wide audience makes a software tool preferred for this task. The core of a successful flowchart is its simplicity. That is why often before beginning making flowchart through software, people draw the sketch on a piece of paper. Designing an effective flowchart means the combination of the data needed to be shown and the simplicity with which you depict it. In ConceptDraw DIAGRAM it really is so simple to draw even the most complex flowcharts. Use Rapid Draw technology for the best results.Samples of Flowcharting
This sample shows the Flowchart for determine is a species heterotroph or autotroph, or a subtype. This diagram has start point and end points. The diamonds on the Flowchart represent the decisions. The Flowcharts are widely used in science, analytics, government, politics, business, engineering, architecture, marketing, manufacturing, administration, etc.Quality Control Chart Software — ISO Flowcharting
Quality Control Chart Software (ISO Flowcharting) - ConceptDraw DIAGRAM extended with Total Quality Management TQM Diagrams Solution from the Quality Management Area is the best diagramming and vector drawing software that allows you to draw the quality control charts quick and easy. The quality control chart is a graphic that illustrates the accordance of processes or products to the intended specifications and degree of differences from them. Depending on what type of data you need analyze, there are used different types of quality control charts: X-bar charts, S charts, Np charts.Audit Flowchart Symbols
The audit is a complex process consisting of defined quantity of steps, which have as a final goal the ensuring of success of a certain business project. It includes the independent examination of data, statements and financial performances of an enterprise for a stated purpose. It is convenient to construct the Audit Flowcharts or Audit Diagrams for visual representation and structuring the audit processes. ConceptDraw DIAGRAM diagramming software enhanced with Audit Flowcharts solution from the Finance and Accounting area of ConceptDraw Solution Park effectively helps to draw the Audit Diagrams for accounting, finance and money management, the Audit Flowcharts for fiscal information tracking, financial inventories and documenting Six Sigma, the decision making Flow Charts, etc. This solution provides the powerful drawing tools, numerous templates and samples, and large quantity of vector audit flowchart symbols that greatly facilitate the process of representation the audit steps and audit results, and designing efficient and visually appealing Audit Flowcharts.Flowcharting Software
A flowchart is a useful type of diagram quite popular in many areas of science and business, which represents some algorithm, workflow or process. ConceptDraw DIAGRAM diagramming and vector graphic software extended with Flowcharts solution from the "Diagrams" area of ConceptDraw Solution Park is also ideal flowcharting software with powerful tools that assist in easily making the Flowcharts of different types and directions, in representing the flowchart steps and describing the flowchart processes, in realizing the flowchart constructions, creating the process flow models, designing the data flow diagrams, and many other flowcharting related diagrams. ConceptDraw DIAGRAM software maximally facilitates the drawing process by means of included predesigned vector objects, which only need to be dragged to your ConceptDraw document from the corresponding library and connected with smart connectors. This way lets equally easy make the simple flowcharts, as well as flowcharts of complex processes and procedures.Accounting Flowchart Symbols
Accounting is a well known and popular tool used for gaining full quantitative information about the finances. The accounting process includes extensive set of activities that begins with transactions and ends with closing of books. It contains all financial information for a given organization, the data about incomes, expenditures, purchases, sales, return, payroll, and many other numerical information. The excellent possibility to create great-looking Accounting Flowcharts is offered by professional ConceptDraw DIAGRAM diagramming and vector drawing software. It includes the Accounting Flowcharts solution containing wide variety of predesigned accounting flowchart symbols. All symbols are easy recognizable, commonly used, vector and professionally designed, so are capable effectively save your time and efforts when representing all stages of accounting work process, the flow of data in an organization, accounting procedures and processes, documents, tasks, responsible people, users, components and authorizations.Flow Chart Symbols
The Flowcharts are incredibly useful and popular tool used in science, business, software development, analytics, engineering, marketing, manufacturing, administration, architecture, government, politics, and many other fields thanks to a variety of existing types of flowcharts. A Flowchart is a visual graphical representation of the process, algorithm, or the set of steps taken for problem's solution. Widely used for designing, visualizing and documenting simple and complex processes and programs, they effectively help to understand the process and to find easier the flaws if they are. Each flowchart type supposes the use of its own set of notations for drawing corresponding diagram, which includes the symbols of process, decision, data, document, data base, termination, initiation processes, processing loops, conditions, etc. It is easily design a Flowchart using the special professional flowchart maker - ConceptDraw DIAGRAM diagram software with numerous predesigned flow chart symbols grouped in libraries of Flowcharts solution from ConceptDraw Solution Park.Business diagrams & Org Charts with ConceptDraw DIAGRAM
The business diagrams are in great demand, they describe the business processes, business tasks and activities which are executed to achieve specific organizational and business goals, increase productivity, reduce costs and errors. They let research and better understand the business processes. ConceptDraw DIAGRAM is a powerful professional cross-platform business graphics and business flowcharting tool which contains hundreds of built-in collections of task-specific vector stencils and templates. They will help you to visualize and structure information, create various Business flowcharts, maps and diagrams with minimal efforts, and add them to your documents and presentations to make them successful. Among them are Data flow diagrams, Organization charts, Business process workflow diagrams, Audit flowcharts, Cause and Effect diagrams, IDEF business process diagrams, Cross-functional flowcharts, PERT charts, Timeline diagrams, Calendars, Marketing diagrams, Pyramids, Target diagrams, Venn diagrams, Comparison charts, Analysis charts, Dashboards, and many more. Being a cross-platform application, ConceptDraw DIAGRAM is very secure, handy, free of bloatware and one of the best alternatives to Visio for Mac users.How to Simplify Flow Charting — Cross-functional Flowchart
In ConceptDraw DIAGRAM it really is sp simple to draw even the most complex cross-functional flowcharts. Use the RapidDraw technology and Cross-Functional libraries in ConceptDraw DIAGRAM for the best results.What process should be essentially adopted. Accounting Flowchart Example
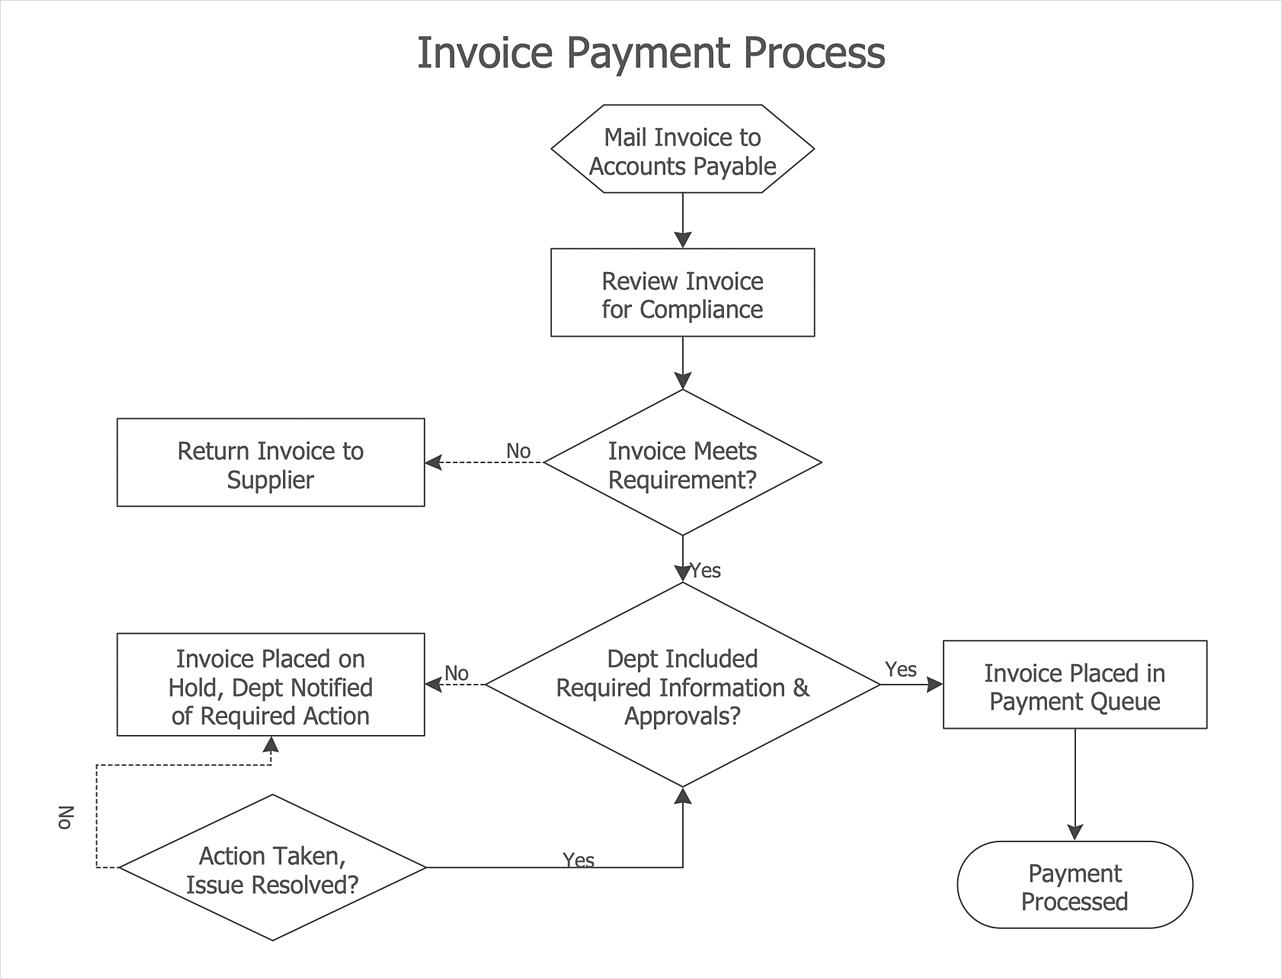
The Accounting flowchart shows how information flows from source documents through the accounting records. The are based on the accounting procedures or processes.TQM Diagram Example
The Total Quality Management Diagram solution helps you and your organization visualize business and industrial processes. Create Total Quality Management diagrams for business process with ConceptDraw software.Creating Flowcharts
Creating Flowcharts - The Flowcharts Solution contains the "Flowchart" and "Flowcharts Rapid Draw" libraries with large quantity of ready-to-use predesigned vector objects. The Flowcharts Solution is available from the ConceptDraw STORE. Use the ConceptDraw STORE to navigate the ConceptDraw Solution Park, manage downloads and updates, take the access to libraries, templates and samples directly from it.Flowchart Components
The ConceptDraw Flowchart component includes a set of samples and templates. This geathered as flowchart maker toolbox which focused on drawing flowcharts of any industry standards.Basic of Flowchart: Meaning and Symbols
Flowcharts are the best for visually representation the business processes and the flow of a custom-order process through various departments within an organization. ConceptDraw DIAGRAM diagramming and vector drawing software extended with Flowcharts solution offers the full set of predesigned basic flowchart symbols which are gathered at two libraries: Flowchart and Flowcharts Rapid Draw. Among them are: process, terminator, decision, data, document, display, manual loop, and many other specific symbols. The meaning for each symbol offered by ConceptDraw gives the presentation about their proposed use in professional Flowcharts for business and technical processes, software algorithms, well-developed structures of web sites, Workflow diagrams, Process flow diagram and correlation in developing on-line instructional projects or business process system. Use of ready flow chart symbols in diagrams is incredibly useful — you need simply drag desired from the libraries to your document and arrange them in required order. There are a few serious alternatives to Visio for Mac, one of them is ConceptDraw DIAGRAM. It is one of the main contender with the most similar features and capabilities.Why Flowchart Important to Accounting Information System?
The Accounting flowchart shows how information flows from source documents through the accounting records. The are based on the accounting procedures or processes. Flowcharts are used to represent accounting information in a system. There are special symbols which are used to create accounting flowcharts. Try conceptdraw flowcharting set of symbols to draw a professional charts.Flowchart Software
A Flowchart visualizes a process or algorithm of a program as step blocks composed of shapes, connected with arrows that show the process flow direction. The Flowcharts give users the ability to represent structural data in a visual form and are widely used to visualize the business and technical processes, as well as software algorithms. ConceptDraw DIAGRAM is a powerful Mac OS X and Windows technical diagramming, business diagramming and flowchart drawing software. Numerous vector stencils, built-in templates and samples created by professional designers are included at the basic package. ConceptDraw DIAGRAM is a classic flowchart maker, which exactly follows the industry standards and provides ready-to-use flowchart symbols gathered at the solutions of ConceptDraw Solution Park. Use the free trial versions of ConceptDraw DIAGRAM software for Mac and PC to experience the powerful possibilities of ConceptDraw DIAGRAM in designing the Flowcharts, Flow Diagrams, Business Flow Charts of different types, styles, and degree of complexity.Build a Flowchart Quickly With AutoConnect
ConceptDraw DIAGRAM is a professional software for building flowcharts quickly with auto-connect technology.HelpDesk
How to Create a Cross-Functional Flowchart Using ConceptDraw Solution
A cross-functional process is a process that involves multiple divisions, each of which makes its part of the entire company workflow. For example product development, lead management, client orders processing – and other critical processes. Using a Cross-Functional flowchart is a clear way of showing each team member’s responsibilities and how processes get shared or transferred between different teams and departments. The Cross-Functional flowchart is a clear way to visualize the document flow in your organization. The ability to create Cross-functional diagrams is provided by the Cross-Functional Flowcharts solution.- Data Flow Diagram | Why Flowchart Important to Accounting ...
- How To Create a FlowChart using ConceptDraw | Flow Chart ...
- Accounting Flowchart Symbols | Accounting Information Systems ...
- The Rhombus Symbol Used In Flowcharting Represents Which ...
- How to Create Flowcharts for an Accounting Information System ...
- Audit Flowcharts | Iso Flowcharting
- Cross-Functional Flowchart Basics | How to Use a Cross ...
- Accounting Flowchart Symbols | Basic Flowchart Symbols and ...
- Basic Flowchart Symbols and Meaning | Gantt chart examples | How ...
- Cross-Functional Flowchart | Audit flowchart - Template | Opportunity ...