Sales Process Flowchart Symbols
The most easier way of creating the visually engaging and informative Sales Process Flowchart is to create the new ConceptDraw document and to use the predesigned vector symbols offered in 6 libraries of the Sales Flowchart Solution. There are more than six types of sales process flow diagrams, ConceptDraw DIAGRAM software is flowchart maker which include six collections of extended flowchart symbols for effective diagramming. There are main collections of color coded flowchart symbols: Sales Department, Sales Steps, Sales Workflow, Sales Symbols and special set of Sales Arrows and Sales Flowchart.How to Create a Social Media DFD Flowchart
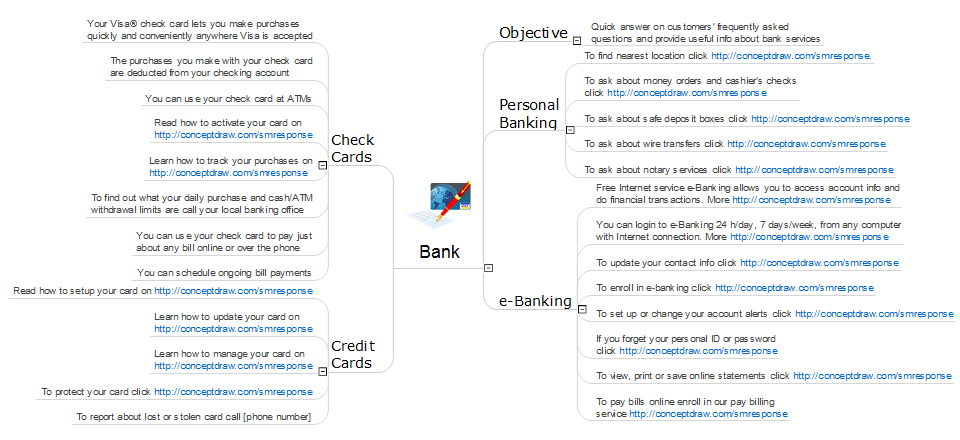
The use of social media in modern conditions helps the companies to be more effective in timely messaging - actively and rapidly response to a customer posts in social media, to find quickly the appropriate response to social media mentions, to save greatly the budget. Many companies even use the social media as a lead tool for promotion. But how to create a Social Media DFD Flowchart, Social Media Response Flowchart or Action Mind Map fast and easy? ConceptDraw DIAGRAM ector graphical software and Social Media Response solution included to ConceptDraw Solution Park assist greatly in their creation. This solution improves the quality of content in social media and helps to build an active customer community. The samples and examples included to Social Media Response solution are helpful for social media teams in developing a social media strategy, in refining and organizing the response process, in creation training materials by trainers and consultants for education the social media groups on how to accomplish the most effectiveness in their daily work.How to Connect Social Media DFD Flowchart with Action Maps
The Social Media Response solution creates interactive social media flow charts and action mind maps. The solution includes a video tutorial and a number of samples helping social media teams refine and organize their response process.Marketing and Sales Organization chart. Organization chart Example
The use of Organization Charts is very popular at the fields of marketing and sales. They help to depict in a visual form a lot of information about organization: the company's structure, relationships of positions within an organization in terms of authorities and responsibilities, and company's strategies. All Organizational Charts are constructed from the similar building blocks (rectangles and lines), this makes them easily for interpretation and understanding by all interested people inside and outside of this company, such as shareholders, employees, investors, distributors, suppliers, customers, etc. Organization Charts can be hand-drawn on the paper, however the preferable is to use a special software. ConceptDraw DIAGRAM diagramming and vector graphics software extended with useful Organizational Charts solution is ideal for easy representing information and data, and professional drawing Marketing and Sales Organization Chart with any depth of detailing. Organizational structure may differ during the company's development, you can design and compare the charts on each stage.How to Prepare Learning Presentations for Training
Interactive tool helps you find the appropriate response to social media mentions quickly.
 ConceptDraw Solution Park
ConceptDraw Solution Park collects graphic extensions, examples and learning materials
Flowchart Example: Flow Chart of Marketing Analysis
An example flowchart of marketing analysis shows main steps you have to challenge writing a marketing analysis.How to Present a Social Media Response Plan DFD to Your Team
Interactive tool helps you find the appropriate response to social media mentions quickly. There are materials to help trainers and consultants develop a social media strategy and provide training for social media groups on how to effectively accomplish their daily work.How to Use the ″Online Store PR Campaign″ Sample
Interactive tool helps you find the appropriate response to social media mentions quickly.What Is an Action Mind Map
Interactive tool helps you find the appropriate response to social media mentions quickly.HelpDesk
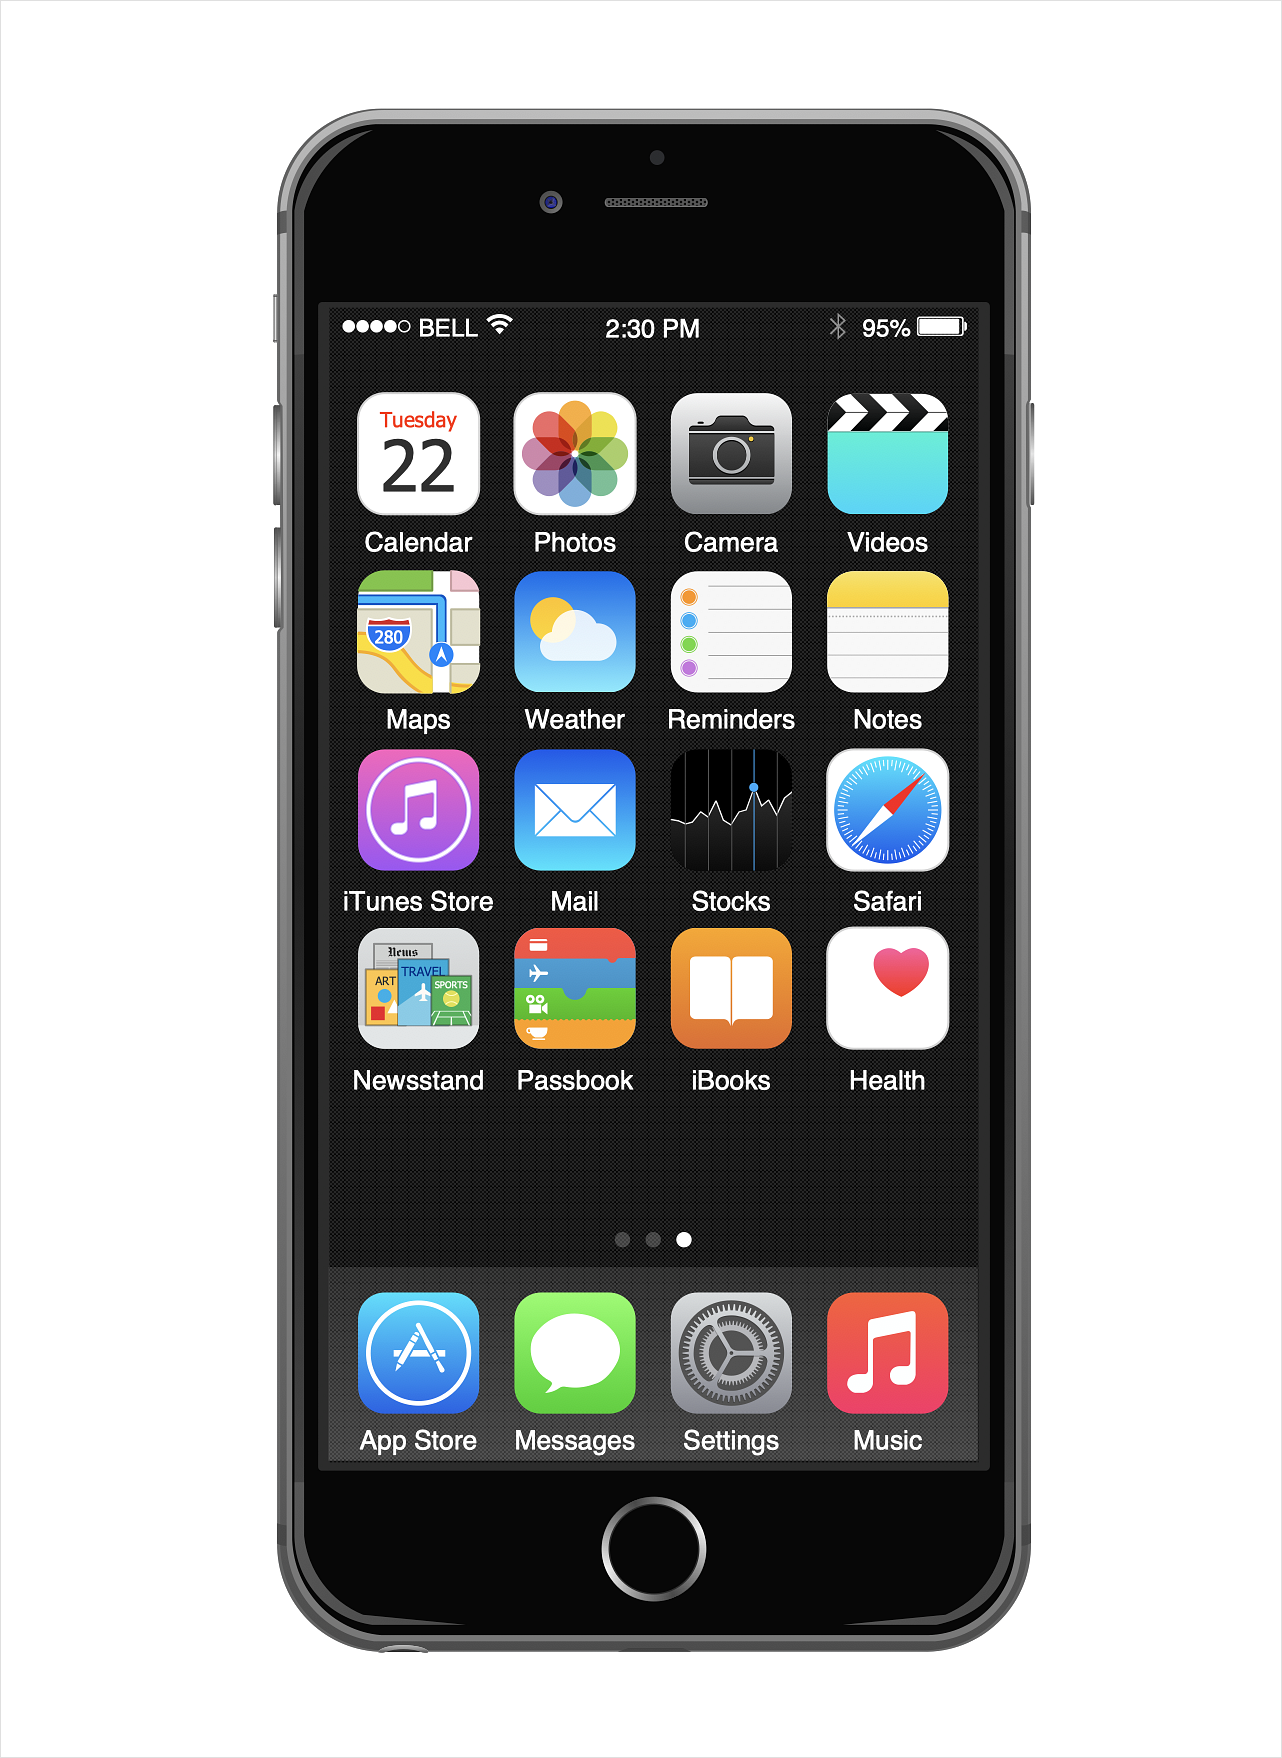
How to Design an Interface Mockup for iPhone Application
The Apple iPhone user interface has become something of a standard for smartphones, and mobile devices in general. A well-designed user interface (UI) is very important for user-friendly navigation and the best correlation with operating system logic. Development of successful iPhone App UI requires a planning and prototyping stage. An iPhone UI diagram can be employed to give a general view of the device's screen, upon which elements can be placed and re-arranged as necessary. Using ConceptDraw DIAGRAM you can mock-up an iPhone UI system so that you can figure out how best to represent user interface (UI) elements for the development of a new iPhone App.Draw Flowcharts with ConceptDraw
Start design your own flowchart with ConceptDraw DIAGRAM and accomplish great results at the moment.Best Program to Create a Fowchart
ConceptDraw - feature-rich flowchart software allows you create professional looking flowcharts.
 Business Package for Management
Package intended for professional who designing and documenting business processes, preparing business reports, plan projects and manage projects, manage organizational changes, prepare operational instructions, supervising specific department of an organization, workout customer service processes and prepare trainings for customer service personal, carry out a variety of duties to organize business workflow.
- Sales Process Flowchart . Flowchart Examples | Sales Process ...
- Sales Process Flowcharts | Marketing and Sales Organization chart ...
- Sales Promotion Flow Chart
- Flow Chart Of Kinds Of Sales Promotion
- Flowchart Marketing Process. Flowchart Examples | Marketing Flow ...
- Sales Promoting Tools Flowchart
- Flow Chart Of Sales Promotion
- Sales Promotion Examples Marketing
- Basic Flowchart Symbols and Meaning | Sales Process Flowcharts ...
- Diagrams Model Sales Promotion
- How to Create a Social Media DFD Flowchart | How to Design an ...
- Sales Process Flowchart . Flowchart Examples | Sales Flowcharts ...
- Flowchart Marketing Process. Flowchart Examples | Process ...
- Sales Process Flowchart . Flowchart Examples | Process Flowchart ...
- Flowchart Marketing Process. Flowchart Examples | Marketing ...
- Sales Process Flowchart . Flowchart Examples | Basic Flowchart ...
- How to Create a HR Process Flowchart Using ConceptDraw PRO ...
- Sales Process Flowchart . Flowchart Examples | Sales Process ...
- Sales Process Flowchart . Flowchart Examples | Cross-Functional ...
- Sales Process Flowchart Symbols | ConceptDraw Solution Park ...


