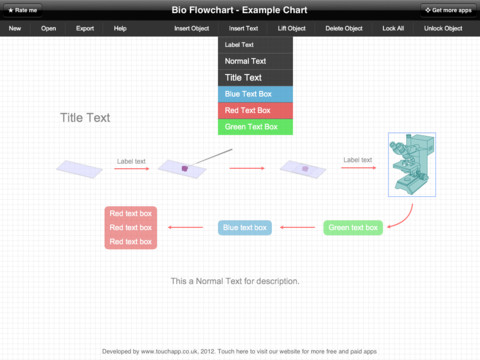
Create Sophisticated Professional Diagrams - Simply
ConceptDraw PRO is a powerful software that helps you create professional and easy drawing diagrams for business, technology, science and education.Bio Flowchart
This app targets to help teachers and students to create vivid and professional biological flowcharts and diagrams in an easy way.
 Cross-Functional Flowcharts
Cross-functional flowcharts are powerful and useful tool for visualizing and analyzing complex business processes which requires involvement of multiple people, teams or even departments. They let clearly represent a sequence of the process steps, the order of operations, relationships between processes and responsible functional units (such as departments or positions).
 Pie Charts
Pie Charts are extensively used in statistics and business for explaining data and work results, in mass media for comparison (i.e. to visualize the percentage for the parts of one total), and in many other fields. The Pie Charts solution for ConceptDraw PRO v10 offers powerful drawing tools, varied templates, samples, and a library of vector stencils for simple construction and design of Pie Charts, Donut Chart, and Pie Graph Worksheets.
Managing the task list
Four lessons explaining how to manage your task list in a Gantt chart. You will learn how to adjust your Gantt chart view, how to add/delete tasks or subtasks, how to change tasks hierarchy, how to show/hide subtasks.
 Logistics Flow Charts
Logistics Flow Charts solution extends ConceptDraw PRO v11 functionality with opportunities of powerful logistics management software. It provides large collection of predesigned vector logistic symbols, pictograms, objects and clipart to help you design with pleasure Logistics flow chart, Logistics process flow diagram, Inventory flow chart, Warehouse flowchart, Warehouse management flow chart, Inventory control flowchart, or any other Logistics diagram. Use this solution for logistics planning, to reflect logistics activities and processes of an enterprise or firm, to depict the company's supply chains, to demonstrate the ways of enhancing the economic stability on the market, to realize logistics reforms and effective products' promotion.
 Organizational Charts
Organizational Charts solution extends ConceptDraw PRO software with samples, templates and library of vector stencils for drawing the org charts.
 Area Charts
Area Charts are used to display the cumulative totals over time using numbers or percentages; or to show trends over time among related attributes. The Area Chart is effective when comparing two or more quantities. Each series of data is typically represented with a different color, the use of color transparency in an object’s transparency shows overlapped areas and smaller areas hidden behind larger areas.
- Organogram For Food Processing Industry
- The Organogram Of A Food Processing Company
- Oganisation Chart Of Food Production Department
- Typical Organogram Of A Food Manufacturing Company
- Food Manufacturing Flow Chart
- Process Flow Chart For Food Production
- Food Processing Organizational Structural Plans
- Hierarchy Chart Food Production
- Organisational Chart For Food And Beverage Manufacturing
- Organization chart - Foodbank | Examples of Flowcharts, Org Charts ...
- Create Sophisticated Professional Diagrams - Simply | Flow chart ...
- Definition Of Flow Chart In Food Processing
- Chart Of Food Production
- Organogram Of A Food Company
- Production Department Hierarchy Chart
- Organogram Of A Manufacturing Company And Their Job Description
- Process Flowchart | Food security assessment - Flowchart ...
- How to Draw an Organization Chart | Examples of Flowcharts, Org ...
- Food Processing Flow Chart Symbols
- Flow chart Example. Warehouse Flowchart | Organizational ...


