 Cross-Functional Flowcharts
Cross-functional flowcharts are powerful and useful tool for visualizing and analyzing complex business processes which requires involvement of multiple people, teams or even departments. They let clearly represent a sequence of the process steps, the order of operations, relationships between processes and responsible functional units (such as departments or positions).
 Flowcharts
The Flowcharts Solution for ConceptDraw PRO v10 is a comprehensive set of examples and samples in several different color themes for professionals that need to graphically represent a process. Solution value is added by basic flow chart template and shapes' library of Flowchart notation. ConceptDraw PRO flow chart creator lets one depict a processes of any complexity and length, as well design of the flowchart either vertically or horizontally.
 Marketing Diagrams
This solution extends ConceptDraw PRO with samples, templates and library of design elements for drawing the marketing diagrams.
 Histograms
How to make a Histogram? Making a Histogram is an incredibly easy process when it is done with ConceptDraw PRO. The Histograms Solution enhances ConceptDraw PRO v10 functionality with extensive drawing tools, numerous samples, and examples; also a quick-start template and library of ready vector stencils for visualization the data and professional drawing Histograms.
 Business Process Model and Notation
Business Process Model and Notation Solution for ConceptDraw PRO is helpful for modeling the business processes of any degree of complexity, documenting them and effective creating diagrams using the BPMN 2.0 standard.
 Project Management Area
Project Management area provides Toolbox solutions to support solving issues related to planning, tracking, milestones, events, resource usage, and other typical project management functions.
 Business Process Diagrams
Business Process Diagrams solution extends the ConceptDraw PRO BPM software with RapidDraw interface, templates, samples and numerous libraries based on the BPMN 1.2 and BPMN 2.0 standards, which give you the possibility to visualize equally easy simple and complex processes, to design business models, to quickly develop and document in details any business processes on the stages of project’s planning and implementation.
Bio Flowchart
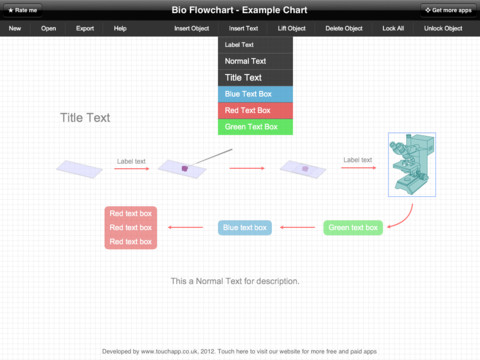
This app targets to help teachers and students to create vivid and professional biological flowcharts and diagrams in an easy way.
 Status Dashboard
Status dashboard solution extends ConceptDraw PRO software with templates, samples and vector stencils libraries with graphic indicators for drawing the visual dashboards showing status data.
- A process with normal flow | Marketing diagrams - Vector stencils ...
- Normal Diagram Examples
- Energy resources diagram | LLNL Flow Charts | Electrical Symbols ...
- Normal distribution graph - Template | Normal distribution | Normal ...
- Electrical Symbols — Power Sources | Energy Pyramid Diagram ...
- Energy Pyramid Diagram | Energy resources diagram | Resources ...
- Cause and effect diagram - Increase in productivity | Porter five ...
- Energy resources diagram | Resources and energy - Vector stencils ...
- Flow chart Example. Warehouse Flowchart | Probability Quality ...
- Organization Chart Of Food And Beverage
- Electrical Symbols — Power Sources | Energy Pyramid Diagram ...
- Electrical Symbols — Power Sources | Energy Pyramid Diagram ...
- Data To Draw Histogram Of Food Security
- How to Draw an Organization Chart | Flowchart Marketing Process ...
- Energy resources diagram | Electrical Symbols — Power Sources ...
- Electrical Symbols — Power Sources | Pie Charts | Energy Pyramid ...
- Energy resources diagram | Resources and energy - Vector stencils ...
- Energy resources diagram | Electrical Symbols — Power Sources ...
- How to Purchase ConceptDraw Products for Academic/Nonprofit ...
