ERD Symbols and Meanings


Functional Block Diagram

What is Entity-Relationship Diagram

Entity-Relationship Diagram

 Network Layout Floor Plans
Network Layout Floor Plans solution extends ConceptDraw DIAGRAM software functionality with powerful tools for quick and efficient documentation the network equipment and displaying its location on the professionally designed Network Layout Floor Plans. Never before creation of Network Layout Floor Plans, Network Communication Plans, Network Topologies Plans and Network Topology Maps was not so easy, convenient and fast as with predesigned templates, samples, examples and comprehensive set of vector design elements included to the Network Layout Floor Plans solution. All listed types of plans will be a good support for the future correct cabling and installation of network equipment.
COM and OLE Diagram

 Marketing Diagrams
Marketing Diagrams solution extends ConceptDraw DIAGRAM diagramming software with abundance of samples, templates and vector design elements intended for easy graphical visualization and drawing different types of Marketing diagrams and graphs, including Branding Strategies Diagram, Five Forces Model Diagram, Decision Tree Diagram, Puzzle Diagram, Step Diagram, Process Chart, Strategy Map, Funnel Diagram, Value Chain Diagram, Ladder of Customer Loyalty Diagram, Leaky Bucket Diagram, Promotional Mix Diagram, Service-Goods Continuum Diagram, Six Markets Model Diagram, Sources of Customer Satisfaction Diagram, etc. Analyze effectively the marketing activity of your company and apply the optimal marketing methods with ConceptDraw DIAGRAM software.
Baseball Field Schema
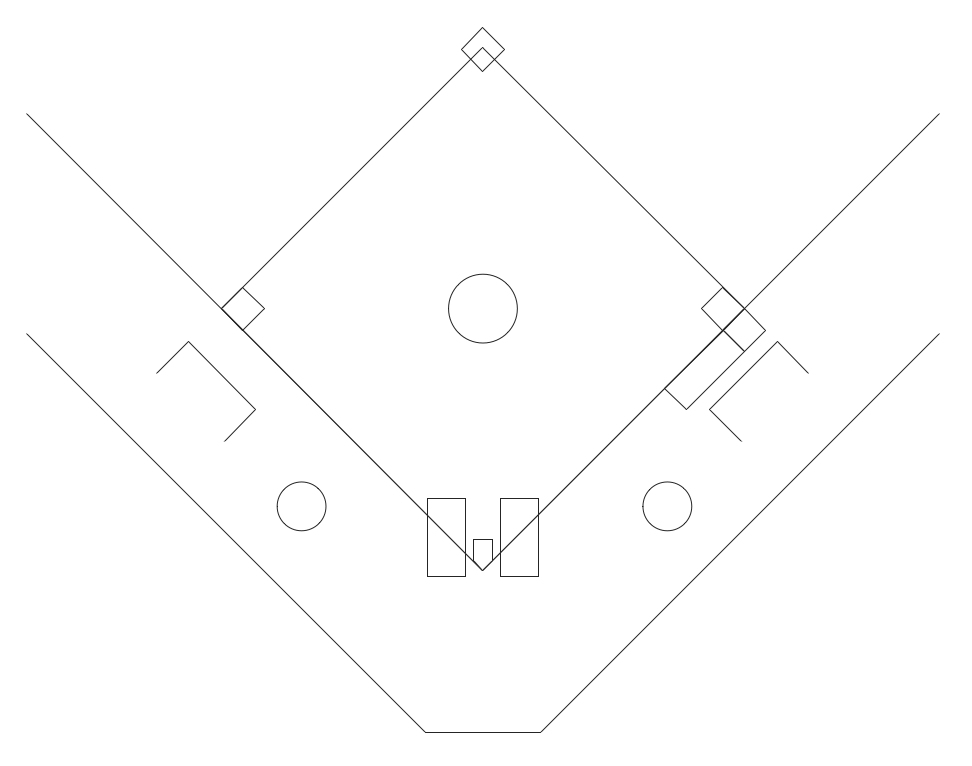
Baseball Diagram – Baseball Field – Corner View – Template
"A baseball field, also called a ball field or a baseball diamond, is the field upon which the game of baseball is played. The term is also used as a metonym for baseball park. ...
The starting point for much of the action on the field is home plate, which is a five-sided slab of whitened rubber, 17-inches square with two of the corners removed so that one edge is 17 inches long, two adjacent sides are 8½ inches and the remaining two sides are 12 inches and set at an angle to make a point. Adjacent to each of the two parallel 8½-inch sides is a batter's box. The point of home plate where the two 12-inch sides meet at right angles, is at one corner of a ninety-foot square. The other three corners of the square, in counterclockwise order from home plate, are called first base, second base, and third base. Three canvas bags fifteen inches (38 cm) square mark the three bases. These three bags along with home plate form the four bases at the corners of the infield." [Baseball field. Wikipedia]
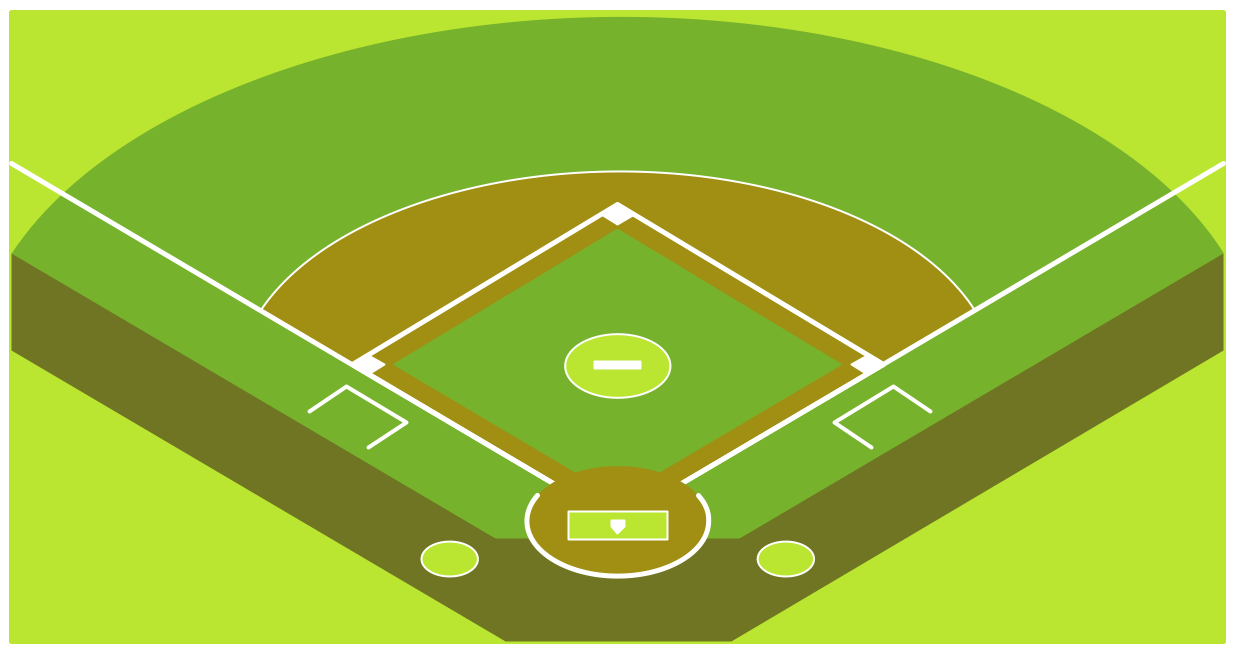
The diagram example "Simple baseball field" was created using the ConceptDraw PRO diagramming and vector drawing software extended with the Baseball solution from the Sport area of ConceptDraw Solution Park.
The starting point for much of the action on the field is home plate, which is a five-sided slab of whitened rubber, 17-inches square with two of the corners removed so that one edge is 17 inches long, two adjacent sides are 8½ inches and the remaining two sides are 12 inches and set at an angle to make a point. Adjacent to each of the two parallel 8½-inch sides is a batter's box. The point of home plate where the two 12-inch sides meet at right angles, is at one corner of a ninety-foot square. The other three corners of the square, in counterclockwise order from home plate, are called first base, second base, and third base. Three canvas bags fifteen inches (38 cm) square mark the three bases. These three bags along with home plate form the four bases at the corners of the infield." [Baseball field. Wikipedia]
The diagram example "Simple baseball field" was created using the ConceptDraw PRO diagramming and vector drawing software extended with the Baseball solution from the Sport area of ConceptDraw Solution Park.
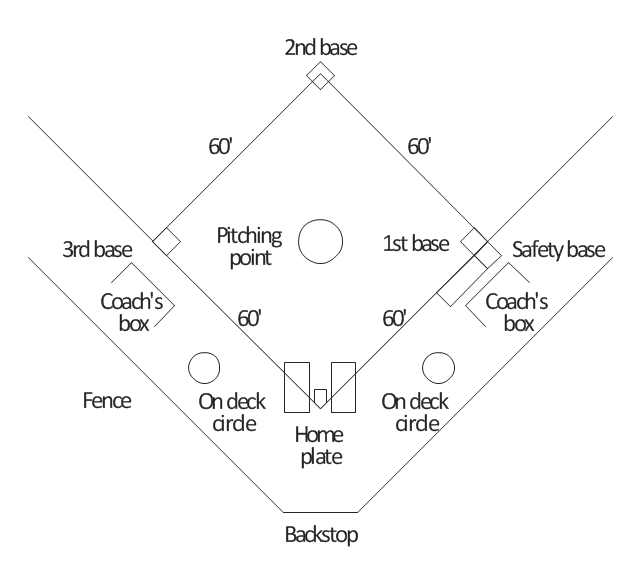
Baseball field diagram
Block Diagram

 Health Food
The Health Food solution contains the set of professionally designed samples and large collection of vector graphic libraries of healthy foods symbols of fruits, vegetables, herbs, nuts, beans, seafood, meat, dairy foods, drinks, which give powerful possi
 Basic Circle-Spoke Diagrams
Basic circle-spoke diagrams are well suited for marketing, management documents, and presentations.
 Cooking Recipes
Create quick and easy recipe diagrams with the Cooking Recipes solution. Make a tasty meal for dinner, for holidays, or for a party.
Geo Map - Asia - Saudi Arabia

- Design Element: Crows Foot for Entity Relationship Diagram - ERD ...
- Mention And Explain Five Flowchart Symbols
- Draw Five Symbols Used In Flow Chart
- Mention Five Flowchart Symbols And Their Function Or Use
- Process Flowchart | UML Block Diagram | Block diagram - Porter's ...
- UML Deployment Diagram Example - ATM System UML diagrams ...
- Block diagram - Porter's five forces model | Block diagram - Porter's ...
- Process Flowchart | Flow Map | Physics Symbols | Draw Five Types ...
- Database Design | Crow's foot ERD - Educational data base ...
- Example Of Five Basic Symbols Of Flowchart
- Draw Five Flow Charting Symbols In Computer
- Data Flow Diagram | Components of ER Diagram | 5 Level pyramid ...
- Competitor Analysis | Block diagram - Porter's five forces model ...
- Chen's ERD of MMORPG | Design elements - ERD (crow's foot ...
- Drawing Of Foot Ball Feild
- Design elements - ERD (crow's foot notation) | Entity Relationship ...
- Draw And State The Function Of Five Flowchart Symbols In Visual ...
- Data Flow Diagram | 5 Level pyramid model diagram - Information ...
- Draw Five Organizational Structure
- Pyramid Diagram | Process Flowchart | ERD Symbols and Meanings ...