Soccer (Football) Diagram Software
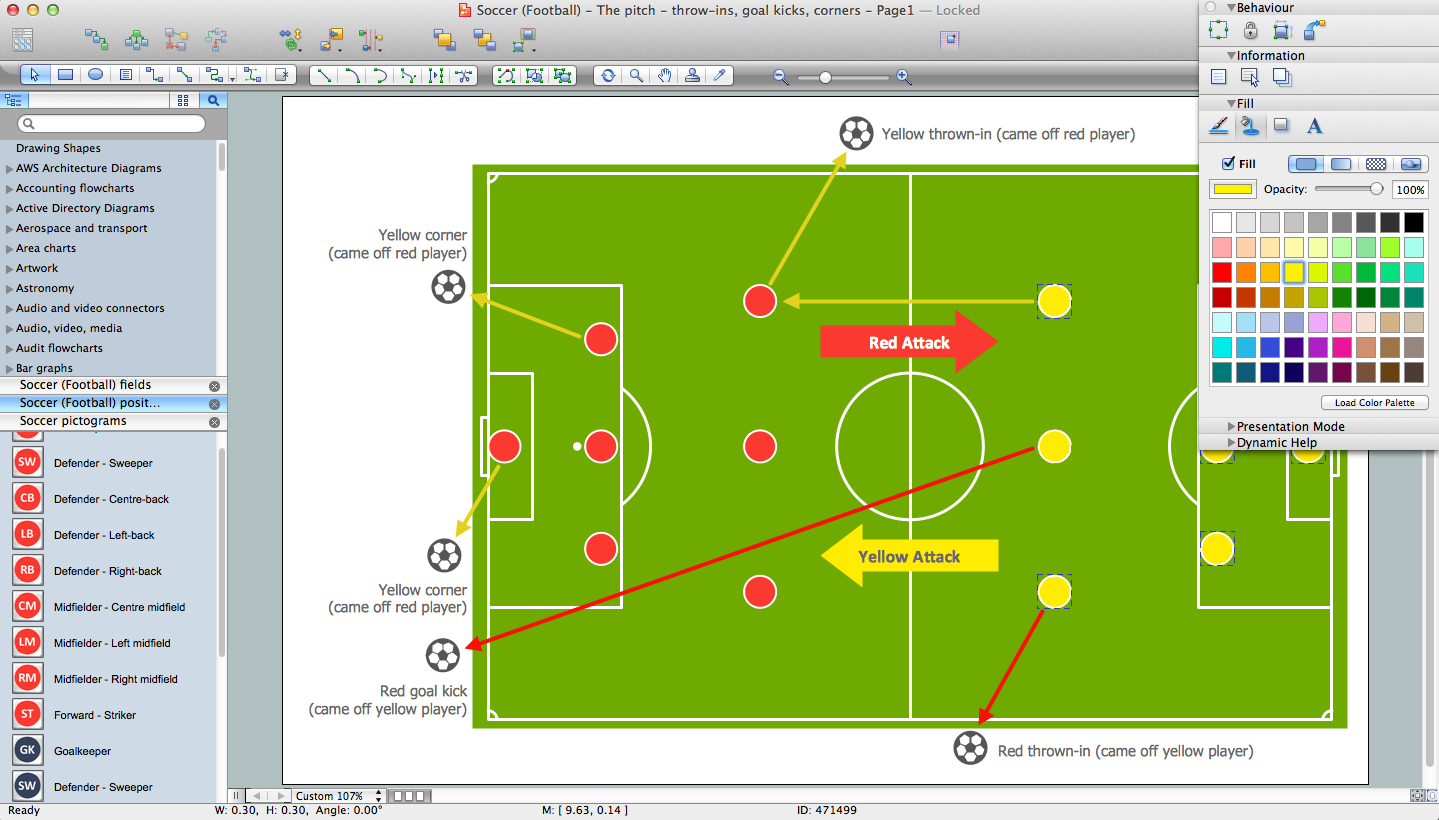
Explaining the soccer strategies and techniques is practically impossible without drawing a diagram. ConceptDraw DIAGRAM diagramming and vector drawing software extended with Soccer solution from the Sport area of ConceptDraw Solution Park is a very convenient and useful tool for designing the soccer-related diagrams.Basketball Plays Diagrams
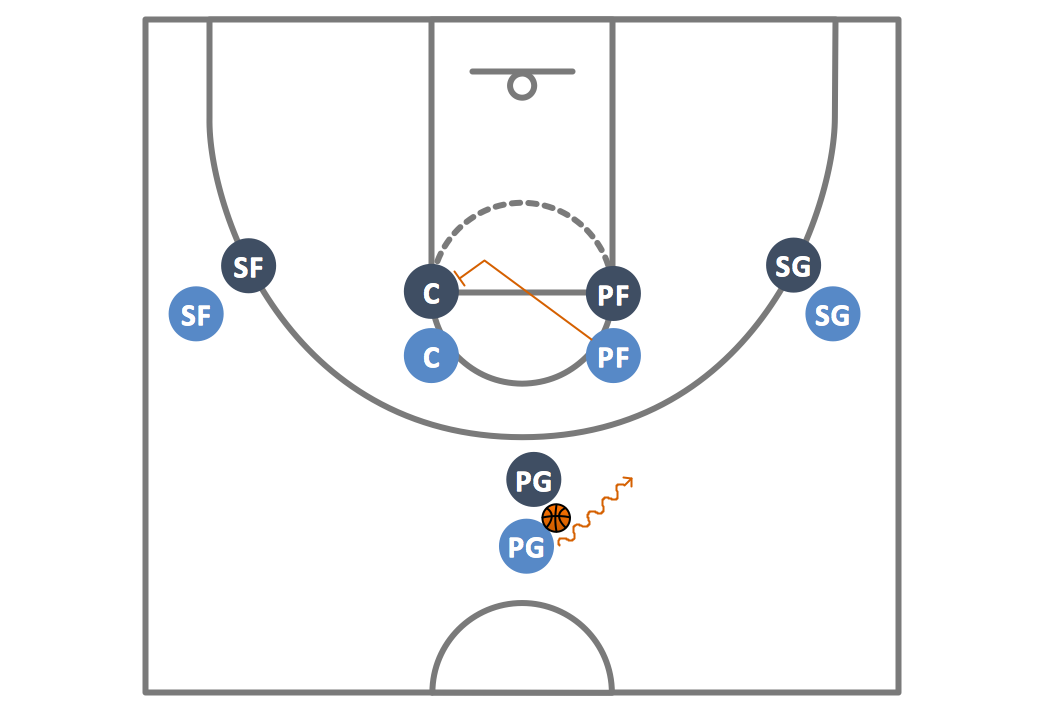
Using the diagrams is the easiest way for coaches and other sport specialists to explain the rules, strategies and tactics of the basketball play. The Basketball solution from the Sport area of ConceptDraw Solution Park was designed as a tool that will help you produce the basketball plays diagrams in a few minutes.Soccer (Football) Positions
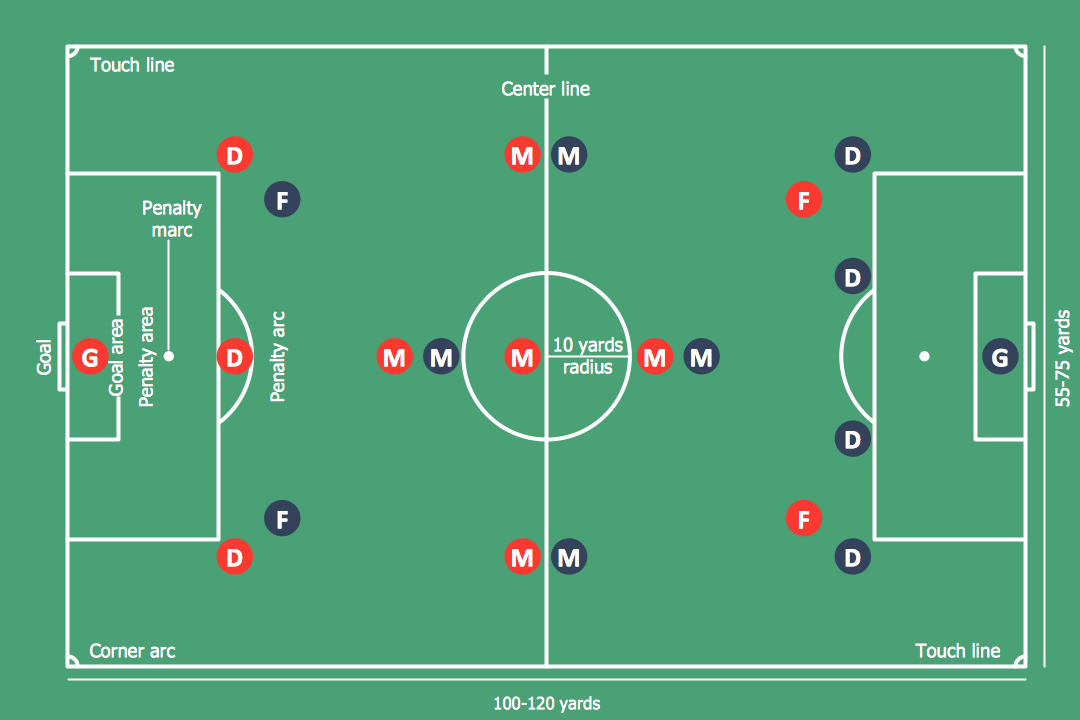
Explaining soccer positions becomes much more easier and time saving with visual drawings. ConceptDraw DIAGRAM software extended with the Soccer solution from the Sport area of ConceptDraw Solution Park is very useful tool that will help you design the soccer-related drawings of any complexity in minutes.Design a Soccer (Football) Field
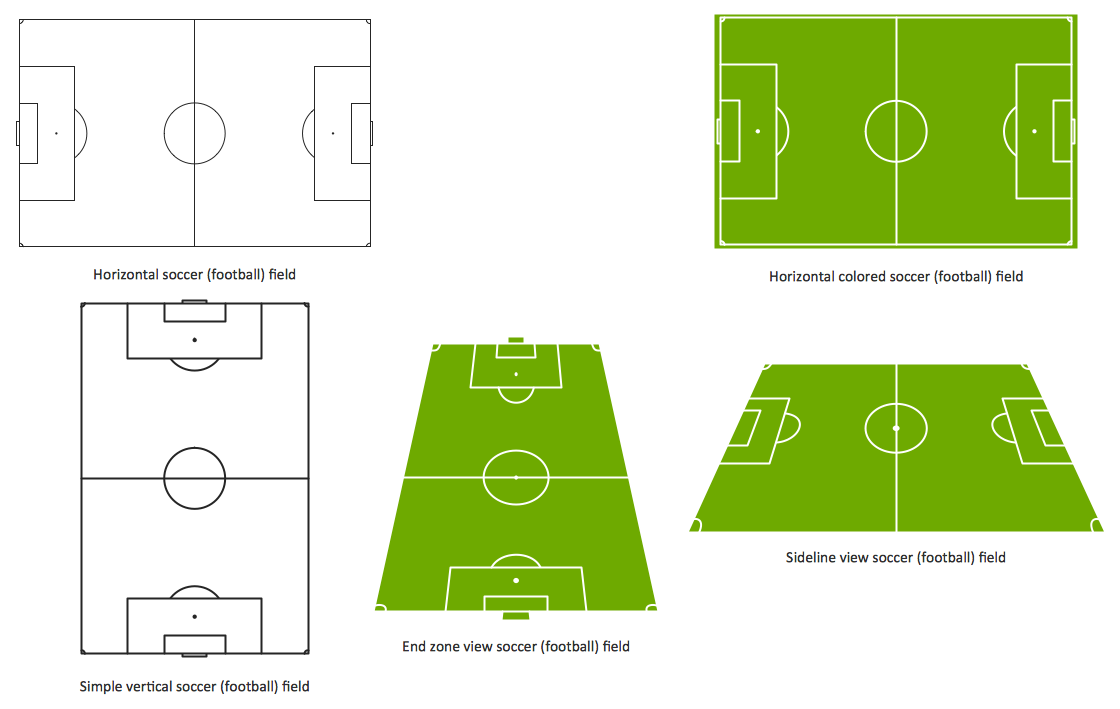
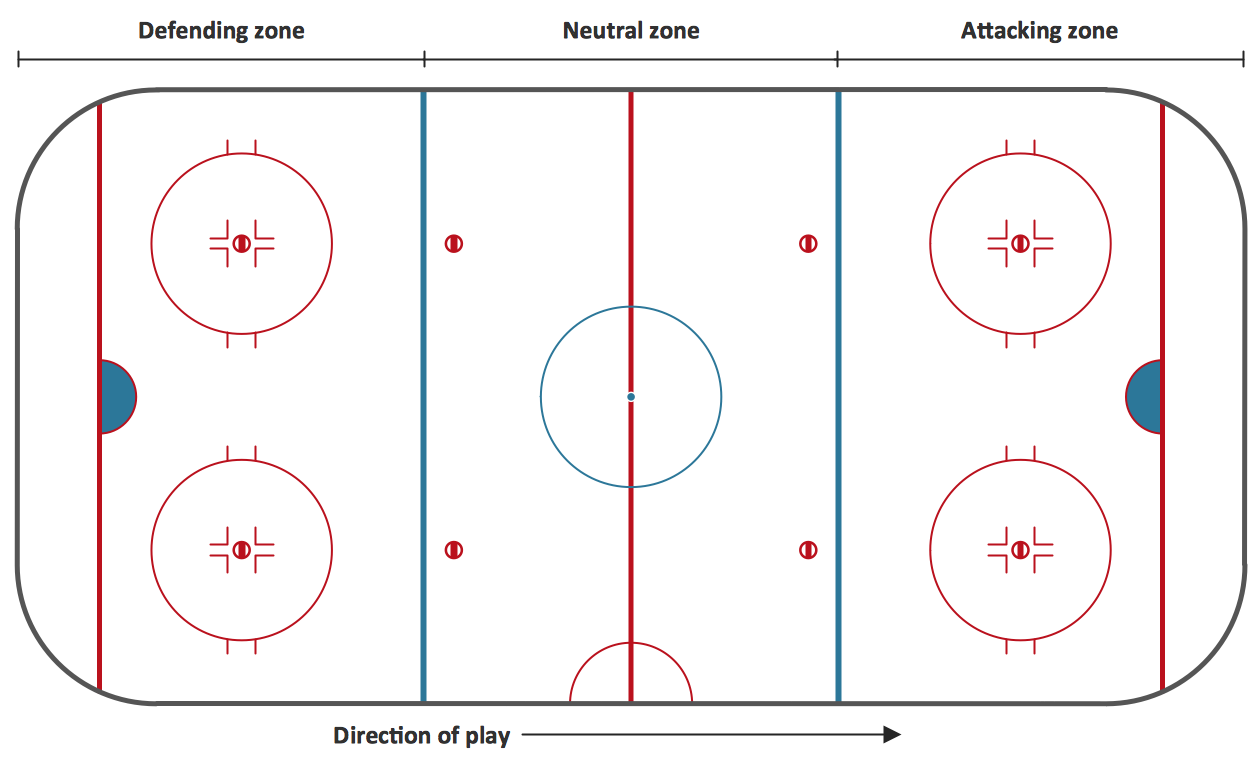
The Soccer (Football) Fields library from the Soccer solution from the Sport area of ConceptDraw Solution Park provides a complete set of predesigned fields: horizontal and vertical located, colored or not, end zone view soccer field.Ice Hockey Rink Diagram
The main advantage of using ConceptDraw Ice Hockey Solution is that you don't need to draw objects manually, you have all you need in libraries, templates and samples. This allows you produce professional ice hockey diagrams as quickly as possible, and then post them to blog or social media, print or present on a large screen.Building Drawing Software for Design Sport Fields
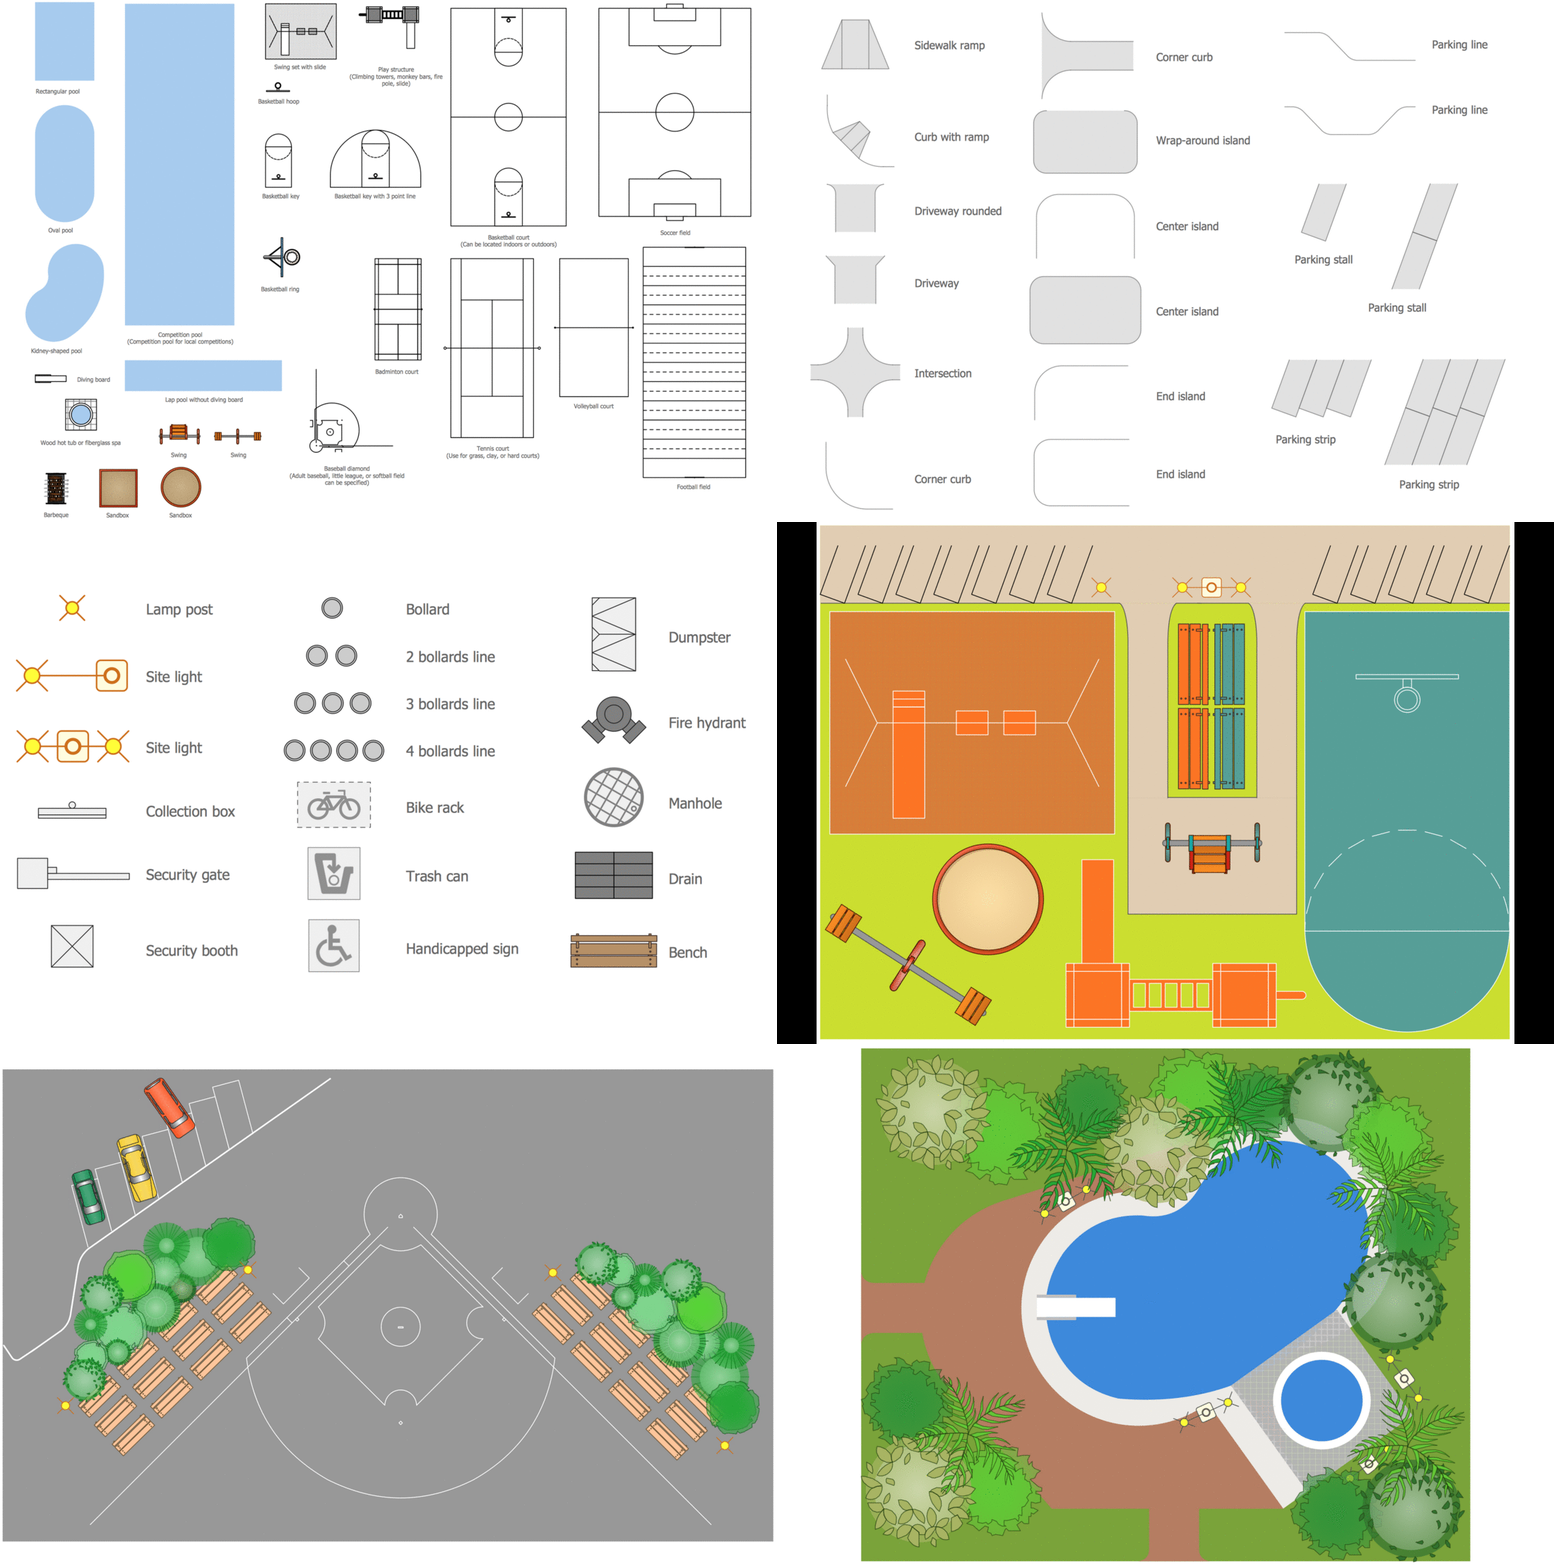
The sport fields, sport complexes, and sport grounds are popular places for all, but especially for children and teenagers who spend there a large amount of their time. So the sport fields must to be safe and carefully thought-out. Where to start and what things to consider when planning and building sport fields? First and foremost you need to take into account is that the fields for football, basketball, volleyball, tennis and other active sports differ by their dimensions, surface and design, and must to be constructed according to the rules for a given game. If the sport field assumes the presence of children of different age, you need organize the comfort staying them together. All installed elements and constructions should bring the maximum benefit and enjoyment from training. That's why the planning and construction the sport field cannot to be realized without a plan. ConceptDraw DIAGRAM building drawing software tools are perfect for design Sport Fields using the ready vector elements from the libraries of Sport Fields Plans solution from Building Plans area.
Basketball Plays Software
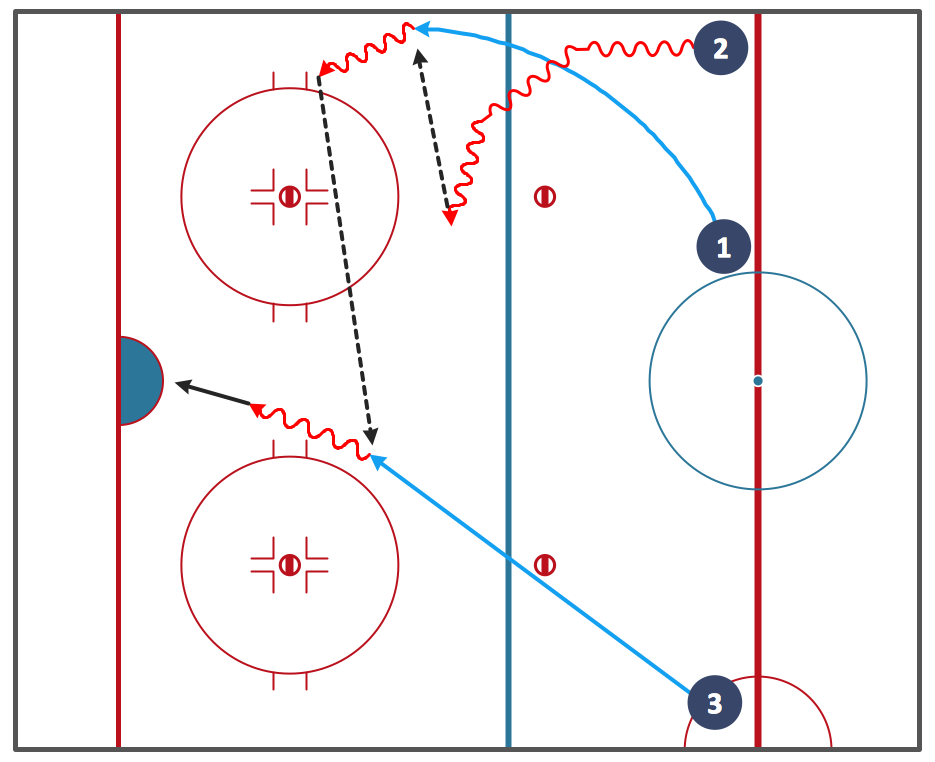
Basketball is a popular sport played by two teams of five players with a ball. The game takes place on a rectangular court. The team goal is to score a ball into the basket of the opponent team. The team with the most points wins the game. ConceptDraw DIAGRAM diagramming and vector drawing software extended with Basketball solution from the Sport area of ConceptDraw Solution Park is a very useful tool for designing the basketball-related diagrams of any complexity.Ice Hockey Diagram — Entering Offensive Zone Drill
ConceptDraw DIAGRAM software extended with the Ice Hockey Solution allows you to draw professional looking ice hockey diagrams in minutes. You can easily customize existing samples or produce you own ones.
 Australia Map
For graphic artists creating accurate maps of Australia. The Australia Map solution - allows designers to map Australia for their needs, offers a collection of scalable graphics representing the political geography of Australia, split into distinct state
 Seven Basic Tools of Quality
Manage quality control in the workplace, using fishbone diagrams, flowcharts, Pareto charts and histograms, provided by the Seven Basic Tools of Quality solution.
- American Football Formation Creator
- Offensive Football Plays And Formations
- Football | Free Football Formation Software
- Soccer ( Football ) Diagram Software | How to Make Soccer Position ...
- Football Formation Maker
- Football Field Grid Template
- Offensive Formation – T- Formation – Diagram | Offensive Strategy ...
- Soccer ( Football ) Formation | Ice Hockey Offside Diagram | Soccer ...
- Soccer ( Football ) Formation | Offensive Play – Double Wing Wedge ...
