HelpDesk
How to Make Soccer Position Diagram Using ConceptDraw PRO
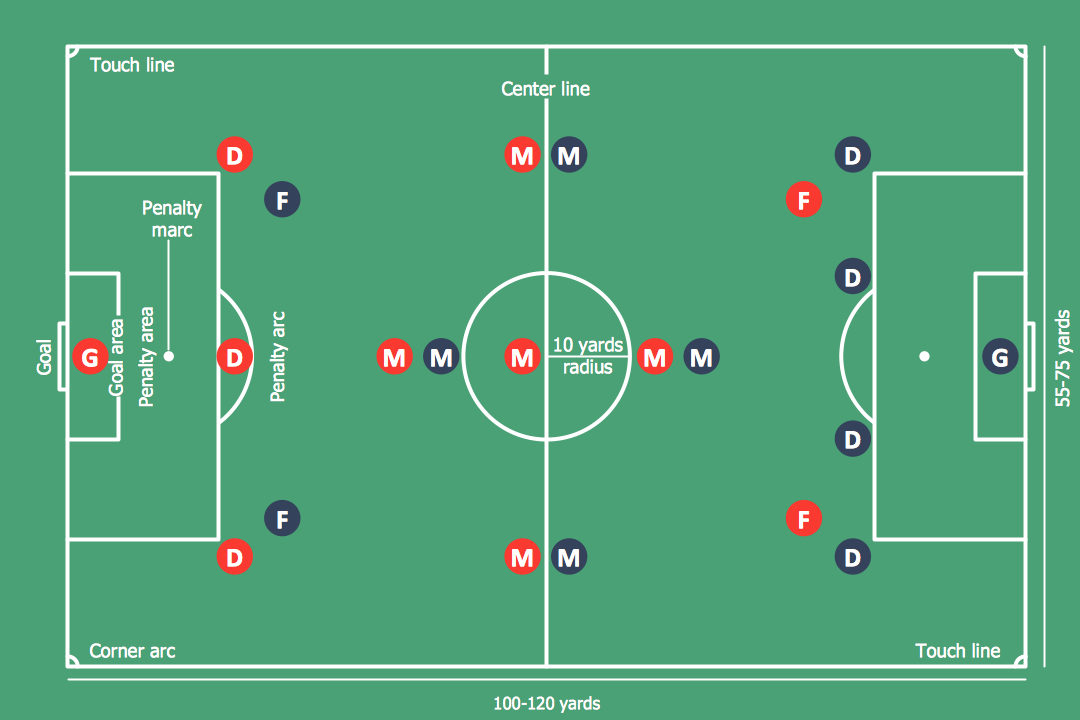
The soccer field has the form of a large rectangle, covered with grass. Dimensions of soccer fields may vary slightly, depending on the level of the game, but all fields have some common characteristics. Soccer players may take different positions. Each soccer position has its own name, and implies certain player functions. Every soccer position has a very specific name and task: Goalkeeper, Defenders, Midfielders and Forwards. During preparation for the game coach met a challenge: how to explain each player's position and his role in the game. The difficulty is the fact that in the course of the game players will often move on the field and do not stay in one place. Football field diagram with dimensions and marking, and positions - it is an important tool for the coach. ConceptDraw PRO helps both coach and players to understand exactly their roles during the particular game. The ability to create Soccer diagrams is contained in the ConceptDraw Soccer solution. The solution provides
 IDEF Business Process Diagrams
Use the IDEF Business Process Diagrams solution to create effective database designs and object-oriented designs, following the integration definition methodology.
ConceptDraw Arrows10 Technology
Connecting objects manually in ConceptDraw PRO is a snap: - points; - Connecting groups of objects; - Auto-routing; - Connectors text; - Snap to Guides ; - Quick.
 Cross-Functional Flowcharts
Cross-functional flowcharts are powerful and useful tool for visualizing and analyzing complex business processes which requires involvement of multiple people, teams or even departments. They let clearly represent a sequence of the process steps, the order of operations, relationships between processes and responsible functional units (such as departments or positions).
 Scatter Diagrams
The Scatter Diagrams solution extends ConceptDraw PRO v10 functionality with templates, samples, and a library of vector stencils that make construction of a Scatter Plot easy. The Scatter Chart Solution makes it easy to design attractive Scatter Diagrams used in various fields of science, work, and life activities. ConceptDraw PRO lets you enter the data to the table and construct the Scatter Plot Graph automatically according to these data.
- Football Wings And Their Functions
- Basketball Court Diagram and Basketball Positions | Football Field ...
- Soccer ( Football ) Positions | Create Soccer ( Football ) Positions ...
- Basketball Court Diagram and Basketball Positions | Functions Of All ...
- Soccer ( Football ) Positions | Soccer ( Football ) Formation | Create ...
- Soccer ( Football ) Positions | Basketball Illustrations | Soccer ...
- Football Wings And Its Functions
- Wings Of Football And There Functions
- Position On Soccer Football Field And It Function
- Football Wings And Functions
- Position Of Players In Football Field And Function
- Soccer ( Football ) Formation | Football Wings With Their Functions
- Soccer ( Football ) Positions | How to Make Soccer Position Diagram ...
- Soccer ( Football ) Formation | Wings And Their Functions In Football
- Football Wings And Function
- Soccer ( Football ) Formation | How to Make Soccer Position Diagram ...
- Basketball Positions And Functions Pdf
- Soccer ( Football ) Positions | Soccer ( Football ) Formation | Design ...
- Soccer ( Football ) Positions | Soccer ( Football ) Formation | How to ...
- Create Soccer ( Football ) Positions

