Soccer (Football) Dimensions
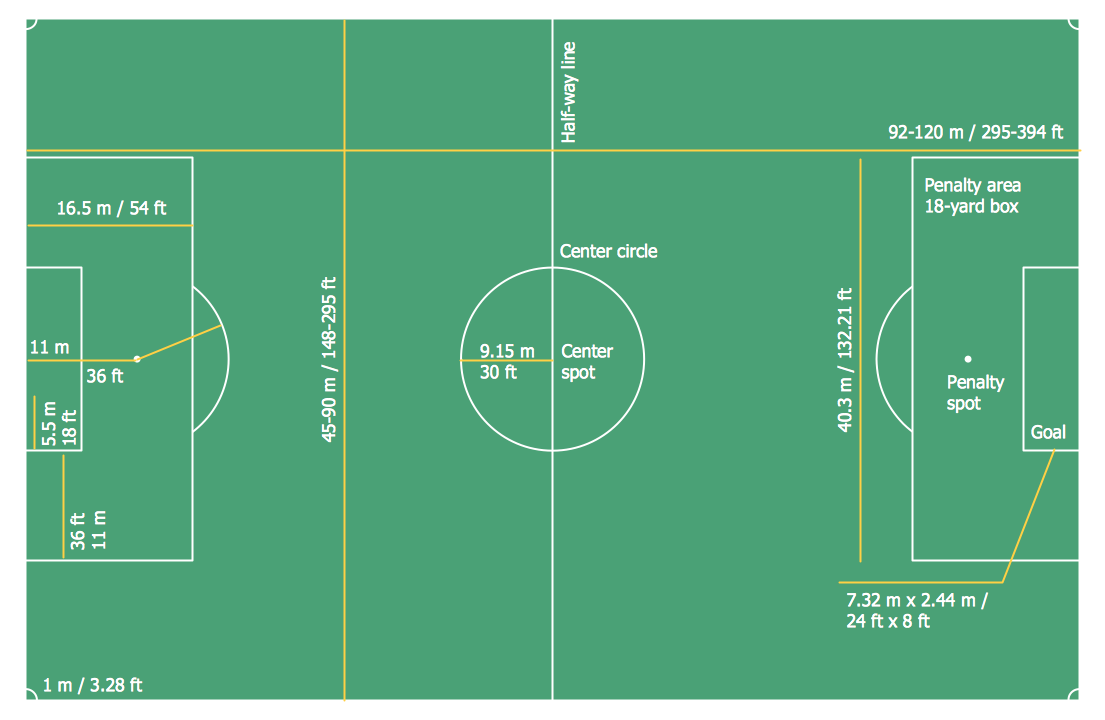
The Soccer solution from the Sport area of ConceptDraw Solution Park is designed as a tool that helps produce soccer illustrations of any complexity in minutes. You can quick and easy design the professional looking plan of the soccer field with set up dimensions.Baseball Diagram – Colored Baseball Field
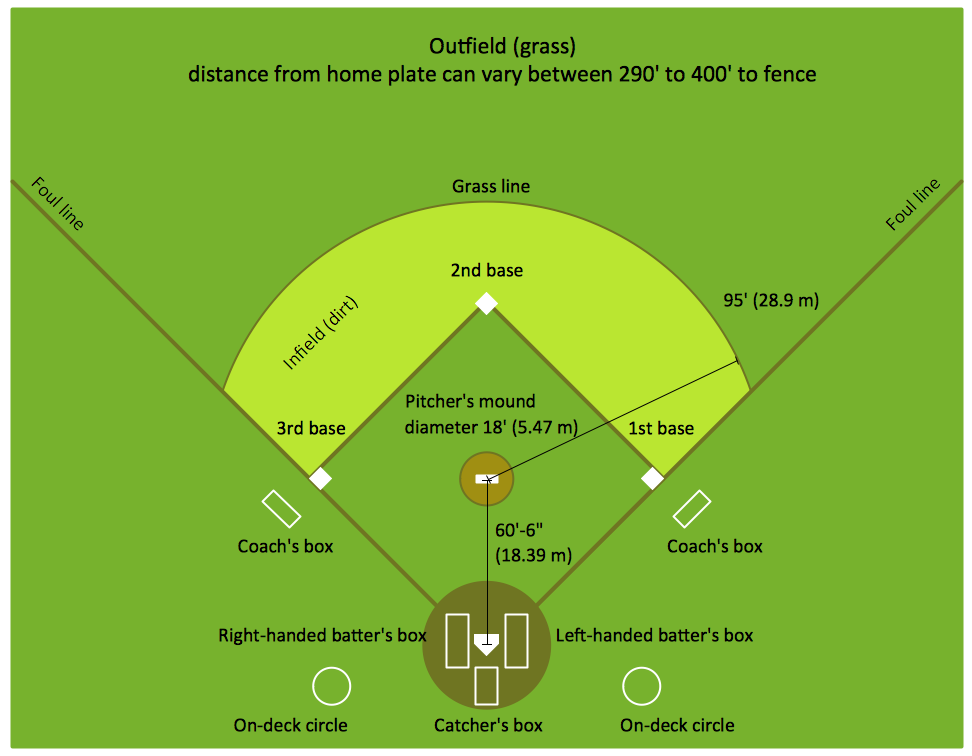
Extending ConceptDraw PRO software with the Baseball solution from the ConceptDraw Solution Park you receive a complete set of libraries, templates and samples allowing to draw baseball diagrams in seconds. You can start from a template, change positions and get ready diagram in some clicks.Basketball Court Diagram and Basketball Positions
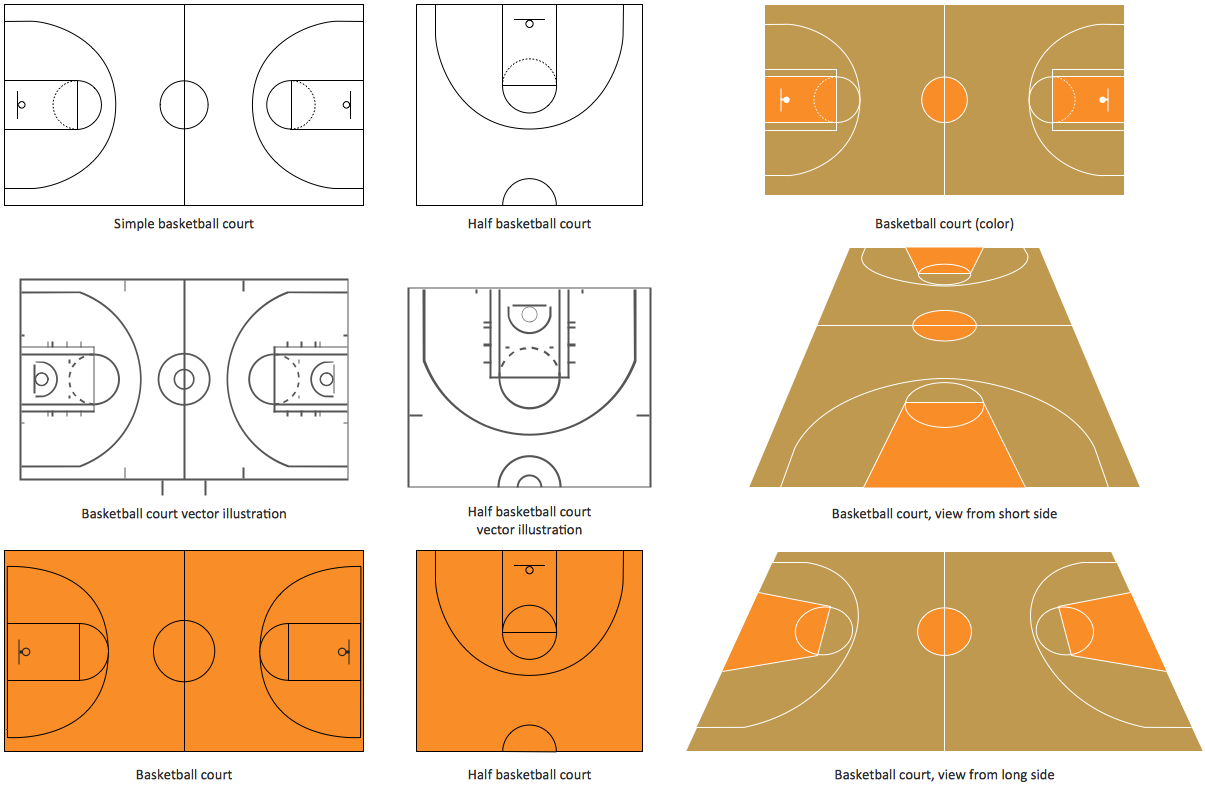
The illustration of possible situations during the basketball matches, presentation of basketball positions and the best tactics, explanation of rules and training to successful game, become much more easier and time saving with visual illustrations and drawings. Creation of several illustrations and comparing them lets effectively show the differences and advantages in positions of players. ConceptDraw PRO software extended with Basketball solution from Sport area of ConceptDraw Solution Park provides the shapes' libraries with different kinds of basketball courts and basketball positions, templates and samples, which will render great help for basketball specialists and fans in drawing professional-looking and illustrative basketball-related diagrams and schematics of any complexity in a few minutes. Extensive export capabilities of ConceptDraw PRO to varied graphical formats open before you wide field for activities and possibility to easy communicate with large quantity of people, which have different software installed on their devices.
 Fishbone Diagrams
The Fishbone Diagrams solution extends ConceptDraw PRO v10 software with the ability to easily draw the Fishbone Diagrams (Ishikawa Diagrams) to clearly see the cause and effect analysis and also problem solving. The vector graphic diagrams produced using this solution can be used in whitepapers, presentations, datasheets, posters, and published technical material.
 Bubble Diagrams
Bubble diagrams have enjoyed great success in software engineering, architecture, economics, medicine, landscape design, scientific and educational process, for ideas organization during brainstorming, for making business illustrations, presentations, planning, design, and strategy development. They are popular because of their simplicity and their powerful visual communication attributes.
 Crow’s Foot Notation
Crow’s Foot Notation solution extends ConceptDraw PRO software with powerful drawing tools, samples and library of predesigned vector Crow's Foot notation icons to help you easy describe the databases using the Entity-Relationship models and design professional-looking ER diagrams based on the popular Crow's Foot notation.
 Computer Network Diagrams
Computer Network Diagrams solution extends ConceptDraw PRO software with samples, templates and libraries of vector stencils for drawing the computer network topology diagrams.
 USA Maps
Use the USA Maps solution to create a map of USA, a US interstate map, printable US maps, US maps with cities and US maps with capitals. Create a complete USA states map.
 UK Map
The Map of UK solution contains collection of professionally designed samples and scalable vector stencil graphics maps, representing the United Kingdom counties, regions and cities. Use the Map of UK solution from ConceptDraw Solution Park as the base fo
 Wireless Networks
The Wireless Networks Solution extends ConceptDraw PRO software with professional diagramming tools to help network engineers and designers efficiently design and create wireless network diagrams that illustrate wireless networks of any speed and complexity.
 Scatter Diagrams
The Scatter Diagrams solution extends ConceptDraw PRO v10 functionality with templates, samples, and a library of vector stencils that make construction of a Scatter Plot easy. The Scatter Chart Solution makes it easy to design attractive Scatter Diagrams used in various fields of science, work, and life activities. ConceptDraw PRO lets you enter the data to the table and construct the Scatter Plot Graph automatically according to these data.
 Entity-Relationship Diagram (ERD)
An Entity-Relationship Diagram (ERD) is a visual presentation of entities and relationships. That type of diagrams is often used in the semi-structured or unstructured data in databases and information systems. At first glance ERD is similar to a flowch
 Seven Basic Tools of Quality
Manage quality control in the workplace, using fishbone diagrams, flowcharts, Pareto charts and histograms, provided by the Seven Basic Tools of Quality solution.
 Quality Mind Map
This solution extends ConceptDraw MINDMAP software with Quality Management Mind Maps (Presentations, Meeting Agendas, Problem to be solved).
 Business Package for Management
Package intended for professional who designing and documenting business processes, preparing business reports, plan projects and manage projects, manage organizational changes, prepare operational instructions, supervising specific department of an organization, workout customer service processes and prepare trainings for customer service personal, carry out a variety of duties to organize business workflow.
- Soccer ( Football ) Dimensions | Horizontal colored football field ...
- Ice Hockey Rink Dimensions | Horizontal colored football field ...
- Volleyball court dimensions | Playground Layout | Horizontal colored ...
- Compulet Field Of Football Meter
- Soccer ( Football ) Dimensions | Ice Hockey Rink Dimensions ...
- Ball Field Sizes
- Base Ball Field Dimension In Meters
- Design a Soccer ( Football ) Field | Soccer ( Football ) Dimensions ...
- Football Playground Dimensions In Meters
- Baseball Field Dimensions In Meters
- Sport Field Plans | Sport field | Volleyball court dimensions | Sports ...
- Volleyball court dimensions | Offensive Play – Double Wing Wedge ...
- Soccer ( Football ) Dimensions | Design a Soccer ( Football ) Field ...
- Picture Of Football Field And Their Metre
- Football Field Dimensions In Meters Pdf
- Soccer ( Football ) Dimensions | Design a Soccer ( Football ) Field ...
- Ice Hockey Rink Dimensions | Basketball Court Dimensions ...
- Football Field Size Dimensions
- Soccer ( Football ) Dimensions | Soccer ( Football ) Field Templates ...
- Ice Hockey Rink Dimensions | Soccer ( Football ) Dimensions ...


