Basic Flowchart Symbols and Meaning
Flowcharts are the best for visually representation the business processes and the flow of a custom-order process through various departments within an organization. ConceptDraw PRO diagramming and vector drawing software extended with Flowcharts solution offers the full set of predesigned basic flowchart symbols which are gathered at two libraries: Flowchart and Flowcharts Rapid Draw. Among them are: process, terminator, decision, data, document, display, manual loop, and many other specific symbols. The meaning for each symbol offered by ConceptDraw gives the presentation about their proposed use in professional Flowcharts for business and technical processes, software algorithms, well-developed structures of web sites, Workflow diagrams, Process flow diagram and correlation in developing on-line instructional projects or business process system. Use of ready flow chart symbols in diagrams is incredibly useful - you need simply drag desired from the libraries to your document and arrange them in required order. There are a few serious alternatives to Visio for Mac, one of them is ConceptDraw PRO. It is one of the main contender with the most similar features and capabilities.
Business Report Pie. Pie Chart Examples
This sample shows the Business Report Pie Chart. The Pie Chart visualizes the data as the proportional parts of a whole, illustrates the numerical proportion. Pie Charts are very useful in the business, statistics, analytics, mass media."In elementary algebra, a quadratic equation (from the Latin quadratus for "square") is any equation having the form
ax^2+bx+c=0
where x represents an unknown, and a, b, and c are constants with a not equal to 0. If a = 0, then the equation is linear, not quadratic. The constants a, b, and c are called, respectively, the quadratic coefficient, the linear coefficient and the constant or free term.
Because the quadratic equation involves only one unknown, it is called "univariate". The quadratic equation only contains powers of x that are non-negative integers, and therefore it is a polynomial equation, and in particular it is a second degree polynomial equation since the greatest power is two.
Quadratic equations can be solved by a process known in American English as factoring and in other varieties of English as factorising, by completing the square, by using the quadratic formula, or by graphing." [Quadratic equation. Wikipedia]
The flowchart example "Solving quadratic equation algorithm" was created using the ConceptDraw PRO diagramming and vector drawing software extended with the Mathematics solution from the Science and Education area of ConceptDraw Solution Park.
Basic Diagramming
Mathematics is an exact science, which studies the values, spatial forms and quantitative relations. It is a science, in which is built large number of various diagrams, charts and graphs that present the material in a clear, visual and colorful form, help to analyze the information and to make certain conclusions. A diagram is a graphical representation of data using the linear segments or geometric shapes, which allows to evaluate the ratio of several values. Depending on the types of solved tasks are used the diagrams of different kinds. A graph is a diagram that shows quantitative dependencies of various processes using the curves. ConceptDraw PRO is a powerful intelligent and multifunctional vector engine for drawing different Mathematical diagrams and graphs, Mathematical illustrations, complex and simple Diagram mathematics, Flowcharts of equation solving process, Line graphs, Scatter plots, Histograms, Block diagrams, Bar charts, Divided bar diagrams, Pie charts, Area charts, Circular arrows diagrams, Venn diagrams, Bubble diagrams, Concept maps, and many others.
Business Process Flowchart Symbols
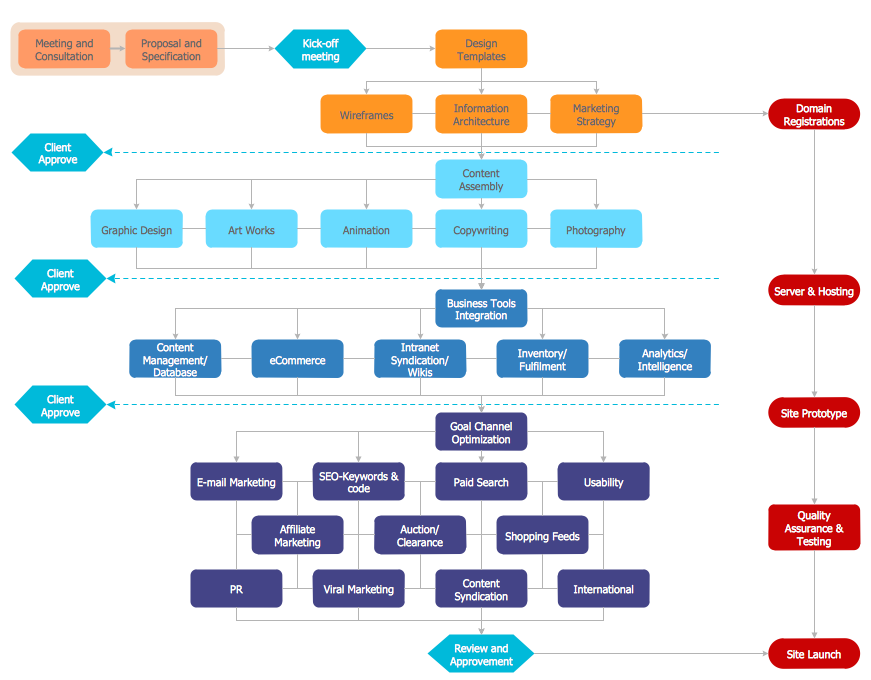
Business process modeling is known in the corporate world as an excellent tool which can speak. Business process flowcharts, diagrams and maps are used to define the business processes in terms of inputs and outputs, to visually represent and effectively explain complex business processes of an enterprise, and also showcase decisions on a single piece of paper. The process of business process mapping supposes the use of special business process flowchart symbols predefined by Business Process Modeling Notation (BPMN) and taking their roots from the data processing diagrams and programming flow charts. In other words the BPMN standard notation is a common language used for business process design and implementation, that guarantees a clarity of designed Business Process Flowcharts for all business analysts, technical developers and business managers. The ability to create professionally-looking Business Process flowcharts, maps and diagrams, is provided by powerful ConceptDraw PRO software and the Business Process Mapping solution included to ConceptDraw Solution Park.How to do presentation of Mind Maps via Skype conference call?
ConceptDraw MINDMAP is powerful and multifunctional mind mapping software with wide variety of relevant features, which make it comfortable for brainstorming, generating ideas, creating beautiful and professional-looking Mind Maps. ConceptDraw MINDMAP provides wide importing and exporting capabilities to variety of formats, among them MS PowerPoint, MS Word, MS Excel, FreeMind, XMind, MindJet Mindmanager, HTML, PDF, graphical formats. An innovative Skype conference call feature deserves the special attention of users, it is useful for teams, it lets to hold the presentations of Mind Maps via Skype and to collaborate in active Skype call. But how to do the presentation of Mind Map via Skype conference call by means of ConceptDraw MINDMAP software? Simply make the Skype conference call, share the presentation via Skype for active call participants using the Remote Presentation for Skype solution, keep the presentation file synchronized between all participants of Skype call. ConceptDraw MINDMAP lets also edit a Mind Map and to do slide show again with no interruption a call.Bar Diagrams for Problem Solving. Create space science bar charts with Bar Graphs Solution
Bar charts represent data in different categories or groups. Create bar graphs for visual solving your scientific problems and data comparison using the ConceptDraw PRO diagramming and vector drawing software extended with the Bar Graphs Solution from the Graphs and Charts area of ConceptDraw Solition Park.Physics Symbols
ConceptDraw PRO diagramming and vector drawing software extended with Physics solution from the Science and Education area is a powerful software for creating various physics diagrams. Physics solution provides all tools that you can need for physics diagrams designing. It includes 3 libraries with predesigned vector physics symbols: Optics Library, Mechanics Library and Nuclear Physics Library.Presenting Documents with Remote Presentation for Skype Solution
Video tutorials on ConceptDraw products. Try it today!Venn Diagram Examples for Problem Solving. Computer Science. Chomsky Hierarchy
A Venn diagram, sometimes referred to as a set diagram, is a diagramming style used to show all the possible logical relations between a finite amount of sets. In mathematical terms, a set is a collection of distinct objects gathered together into a group, which can then itself be termed as a single object. Venn diagrams represent these objects on a page as circles or ellipses, and their placement in relation to each other describes the relationships between them. The Venn diagram example below visualizes the the class of language inclusions described by the Chomsky hierarchy.HelpDesk
How to Make a Rapid Draw Object
The Rapid Draw technology is an automatic drawing system. It is designed to significantly reduce the time of creating flowcharts and diagrams. Especially those, consisting from some typical entities. You can extend the standard ConceptDraw PRO object libraries with new objects by customizing any item from any library and assigning it with Rapid Draw features. You can quickly create and edit complex drawings using Rapid Draw technology and your self-created objects.Process Flow Diagram Symbols
Chemical and Process Engineering Solution from the Industrial Engineering Area of ConceptDraw Solution Park is a unique tool which contains variety of predesigned process flow diagram symbols for easy creating various Chemical and Process Flow Diagrams in ConceptDraw PRO.IDEF4 Standard
Use Case Diagrams technology. IDEF4 standard implies not only graphical presentation but the additional information about diagrams of heredity, methods systematization and types which are contained in specifications.Product Overview
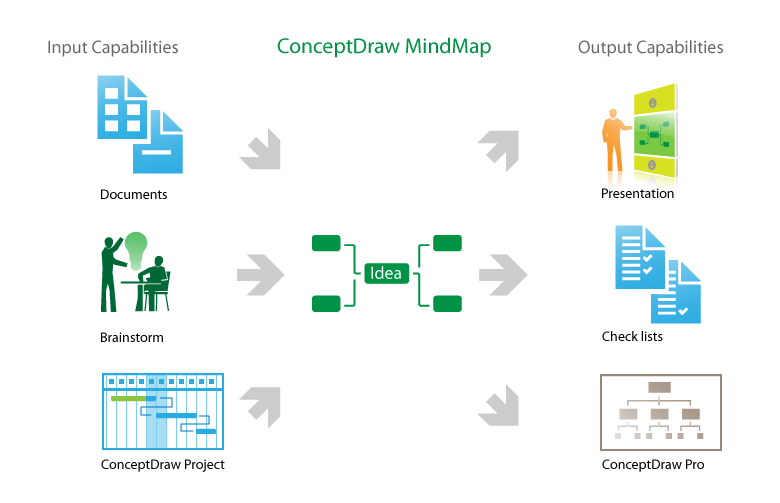
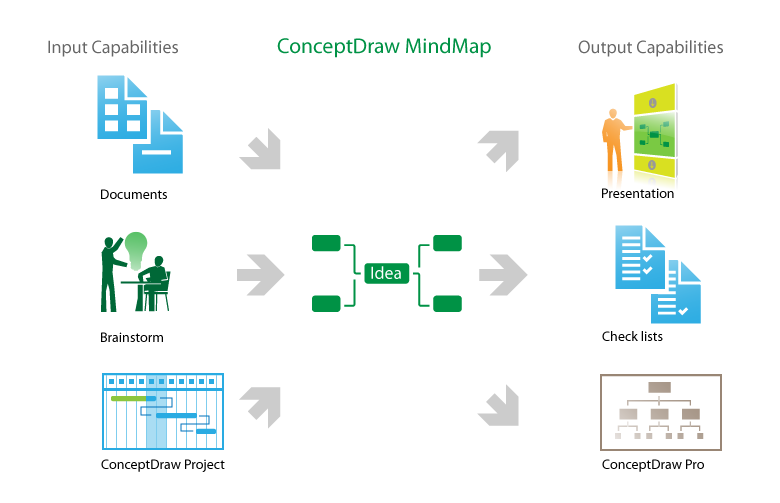
The role of ConceptDraw MINDMAP is to organize and plan idea development and communicate between process participants. Mind maps are convenient to prepare presentations for team and management and send task lists and related information.- Euclidean algorithm - Flowchart | Solving quadratic equation ...
- Solving quadratic equation algorithm - Flowchart | Simple Flow ...
- Basic Flowchart Symbols and Meaning | Types of Flowcharts ...
- What Is The Formula Of Flow Chart
- Solving quadratic equation algorithm - Flowchart | Mathematics ...
- Solving quadratic equation algorithm - Flowchart | Euclidean ...
- Solving quadratic equation algorithm - Flowchart | Process ...
- Solving quadratic equation algorithm - Flowchart | Basic Flowchart ...
- Solving quadratic equation algorithm - Flowchart | Basic ...
- Basic Diagramming | Solving quadratic equation algorithm ...
- Diagram Flow Chart | Program Evaluation and Review Technique ...
- Solving quadratic equation algorithm - Flowchart | Basic ...
- Basic Flowchart Symbols and Meaning | Types of Flowcharts ...
- Technical Flow Chart | Solving quadratic equation algorithm ...
- Basic Flowchart Symbols and Meaning | Simple Flow Chart ...
- Example Free Mind Mind Maps For Flow Charts
- Floor Plan With Quadratic Formula
- Solving quadratic equation algorithm - Flowchart | Basic ...
- Example Draw Algorithim Flow Chart
- Top 5 Android Flow Chart Apps | Basic Audit Flowchart. Flowchart ...


