 AWS Architecture Diagrams
AWS Architecture Diagrams with powerful drawing tools and numerous predesigned Amazon icons and AWS simple icons is the best for creation the AWS Architecture Diagrams, describing the use of Amazon Web Services or Amazon Cloud Services, their application for development and implementation the systems running on the AWS infrastructure. The multifarious samples give you the good understanding of AWS platform, its structure, services, resources and features, wide opportunities, advantages and benefits from their use; solution’s templates are essential and helpful when designing, description and implementing the AWS infrastructure-based systems. Use them in technical documentation, advertising and marketing materials, in specifications, presentation slides, whitepapers, datasheets, posters, etc.
Landscape Drawing
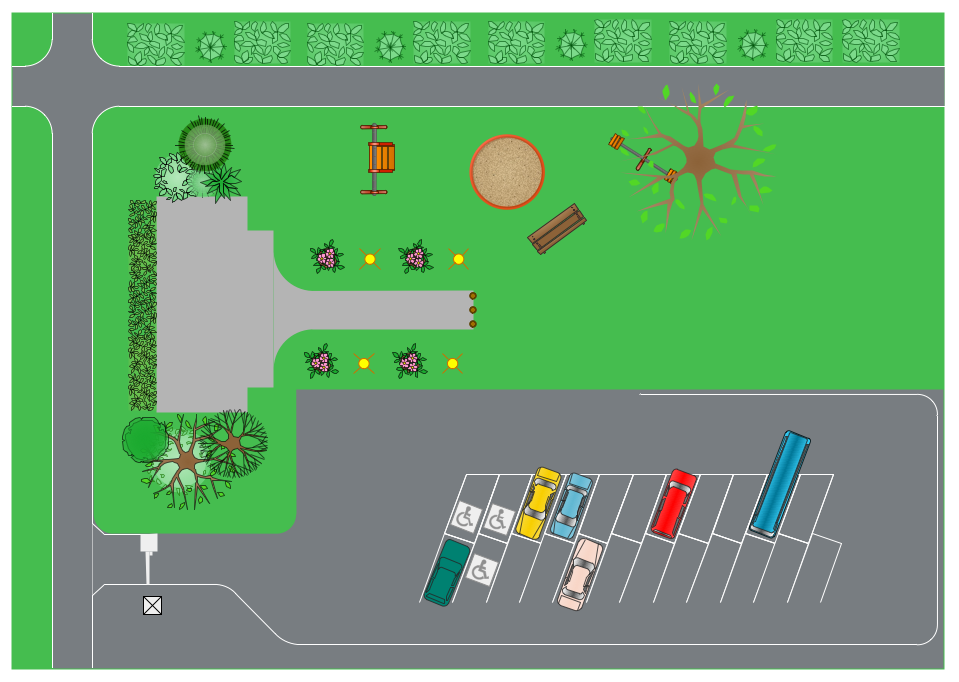
Develop of landscape drawing is a complex process which requires great efforts and inspiration. ConceptDraw DIAGRAM is a powerful diagramming and vector drawing software. Extended with Site Plans Solution from the Building Plans Area, ConceptDraw DIAGRAM will help to make this process easier.Planogram Software and Retail Plan Software
The ConceptDraw DIAGRAM Planogram Software and Retail Plan Software offers powerful tools of Enterprise Architecture Diagrams Solution for visualization the market analysis and easy making successful Retail Plans and Planograms with useful detailed recommendations about placing products and optimization the shelf space.Project management - Design Elements
These vector illustrations and cliparts are created using ConceptDraw DIAGRAM for drawing the Project management Illustrations and contain plenty of project management design elements. The clipart library Project management includes 35 icons. This symbols used by the best marketing project management software, typically by project management reporting software for presentation on project status and results.Organogram Software
Organizing process is the process of creating the organizational structure of an enterprise. The organizing process consists of several stages. First, you need to divide the organization into departments, respectively to strategies, and then establish relationships of authority. After that, managing director delegates his rights and authorities.
 Entity-Relationship Diagram (ERD)
An Entity-Relationship Diagram (ERD) is a visual presentation of entities and relationships. That type of diagrams is often used in the semi-structured or unstructured data in databases and information systems. At first glance ERD is similar to a flowch
Food Court
Food courts are one of the most rapidly developing areas of the restaurant business. ConceptDraw DIAGRAM diagramming and vector drawing software offers a Food Court solution from the Food and Beverage area with wide capabilities for planning, design, developing and advertising of a Food Court.Interior Design. Site Plan — Design Elements
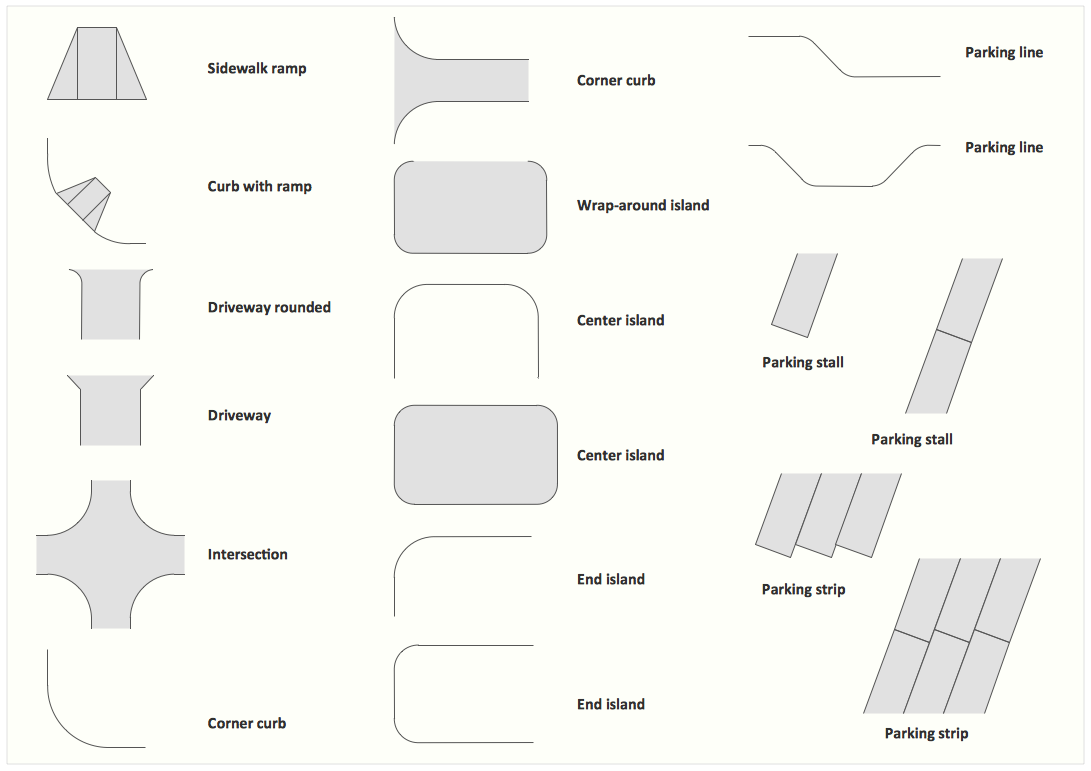
Site plans are large scale drawings that illustrate a lot of useful information, such as location of buildings on the surrounding territories, topography of the site, roads, footpaths, paved and hardstandings areas, ramps, parking areas, fencing, walls and gates, landscape elements, trees and plants, layout of external lighting and service runs, adjoining and adjacent structures, surrounding streets, and many other details. On each Site plan are also designated the scale, dimensions, site boundaries, key materials, and other additional notes. ConceptDraw DIAGRAM diagramming and interior design software extended with Site Plans solution from Building Plans area contains Parking and Roads, Site Accessories, Trees and Plants libraries with numerous collection of ready-to-use vector design elements for drawing detailed Site plans, Site design plans, Structural site plans, Landscape drawings for any locality and of any complexity without efforts. This software will be also useful for planning the parks, creation yard layouts, development residential and commercial landscape designs.Pyramid Diagram and Pyramid Chart
Pyramid Diagram, Triangle Chart or Triangular Diagram is a convenient and useful type of diagrams, which lets represent the data hierarchical structure and to illustrate the foundation-based relationships between the hierarchy levels. Pyramid Diagrams are used to visualize effectively the hierarchical, as well as proportional and foundation-based relationships, the process steps, the interconnections of organizational layers or topics. ConceptDraw DIAGRAM software enhanced with Pyramid Diagrams solution from Marketing area of ConceptDraw Solution Park is a powerful business charting software, that includes all required tools for designing the multilevel Pyramid Diagrams as quickly as possible. The build-in vector stencils and templates are the great aid for designers, a variety of examples and samples is a good base and source of inspiration. Use attractive and vivid 2D and 3D Pyramid Diagrams and Triangle Charts designed in ConceptDraw DIAGRAM to illustrate your documents, presentations, infographics, articles, reports, websites, etc.
 Active Directory Diagrams
Active Directory Diagrams solution significantly extends the capabilities of ConceptDraw DIAGRAM software with special Active Directory samples, convenient template and libraries of Active Directory vector stencils, common icons of sites and services, icons of LDPA elements, which were developed to help you in planning and modelling network structures and network topologies, in designing excellently looking Active Directory diagrams, Active Directory Structure diagrams, and Active Directory Services diagram, which are perfect way to visualize detailed structures of Microsoft Windows networks, Active Directory Domain topology, Active Directory Site topology, Organizational Units (OU), and Exchange Server organization.
- Mini Hotel Floor Plan. Floor Plan Examples | Hotel Floorplan | Hotel ...
- Network Layout Floor Plans | How to Create a Network Layout Floor ...
- Network Layout Floor Plans | Computer Network Diagrams | How to ...
- Cafe Design Ideas | Restaurant Floor Plan | How To use House ...
- Marketing plan - Circular diagram | Marketing Diagrams | Internet ...
- Network Layout Floor Plans
- Office Layout Plans | Network Layout Floor Plans | Network Diagram ...
- Lighting and switch layout | Interior Design . Site Plan — Design ...
- Industrial transport - Design elements | Aircraft - Design Elements ...
- How to Create a Network Layout Floor Plan | Network Layout Floor ...


