This TQM diagram sample was redesigned from the illustration of "Inland acid sulfate soil and water quality fact sheet" from website of the Department of the Environment of the Australian Government.
[environment.gov.au/ resource/ inland-acid-sulfate-soil-and-water-quality-fact-sheet]
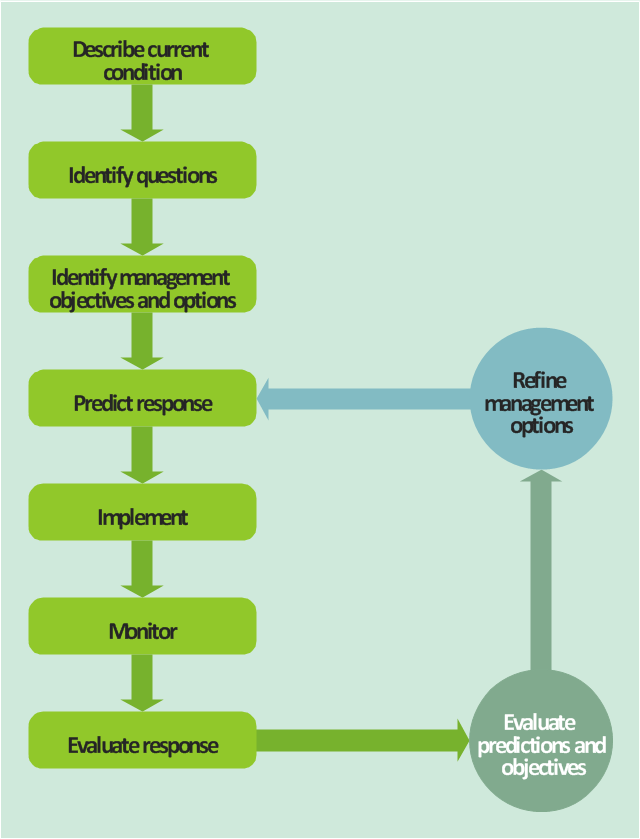
"Adaptive management (AM), also known as adaptive resource management (ARM), is a structured, iterative process of robust decision making in the face of uncertainty, with an aim to reducing uncertainty over time via system monitoring. In this way, decision making simultaneously meets one or more resource management objectives and, either passively or actively, accrues information needed to improve future management. Adaptive management is a tool which should be used not only to change a system, but also to learn about the system (Holling 1978). Because adaptive management is based on a learning process, it improves long-run management outcomes. The challenge in using the adaptive management approach lies in finding the correct balance between gaining knowledge to improve management in the future and achieving the best short-term outcome based on current knowledge (Allan & Stankey 2009)." [Adaptive management. Wikipedia]
The TQM flowchart example "Acid sulfate soil adaptive management framework" was created using the ConceptDraw PRO diagramming and vector drawing software extended with the Total Quality Management (TQM) Diagrams solution from the Quality area of ConceptDraw Solution Park.
[environment.gov.au/ resource/ inland-acid-sulfate-soil-and-water-quality-fact-sheet]
"Adaptive management (AM), also known as adaptive resource management (ARM), is a structured, iterative process of robust decision making in the face of uncertainty, with an aim to reducing uncertainty over time via system monitoring. In this way, decision making simultaneously meets one or more resource management objectives and, either passively or actively, accrues information needed to improve future management. Adaptive management is a tool which should be used not only to change a system, but also to learn about the system (Holling 1978). Because adaptive management is based on a learning process, it improves long-run management outcomes. The challenge in using the adaptive management approach lies in finding the correct balance between gaining knowledge to improve management in the future and achieving the best short-term outcome based on current knowledge (Allan & Stankey 2009)." [Adaptive management. Wikipedia]
The TQM flowchart example "Acid sulfate soil adaptive management framework" was created using the ConceptDraw PRO diagramming and vector drawing software extended with the Total Quality Management (TQM) Diagrams solution from the Quality area of ConceptDraw Solution Park.
TQM diagram
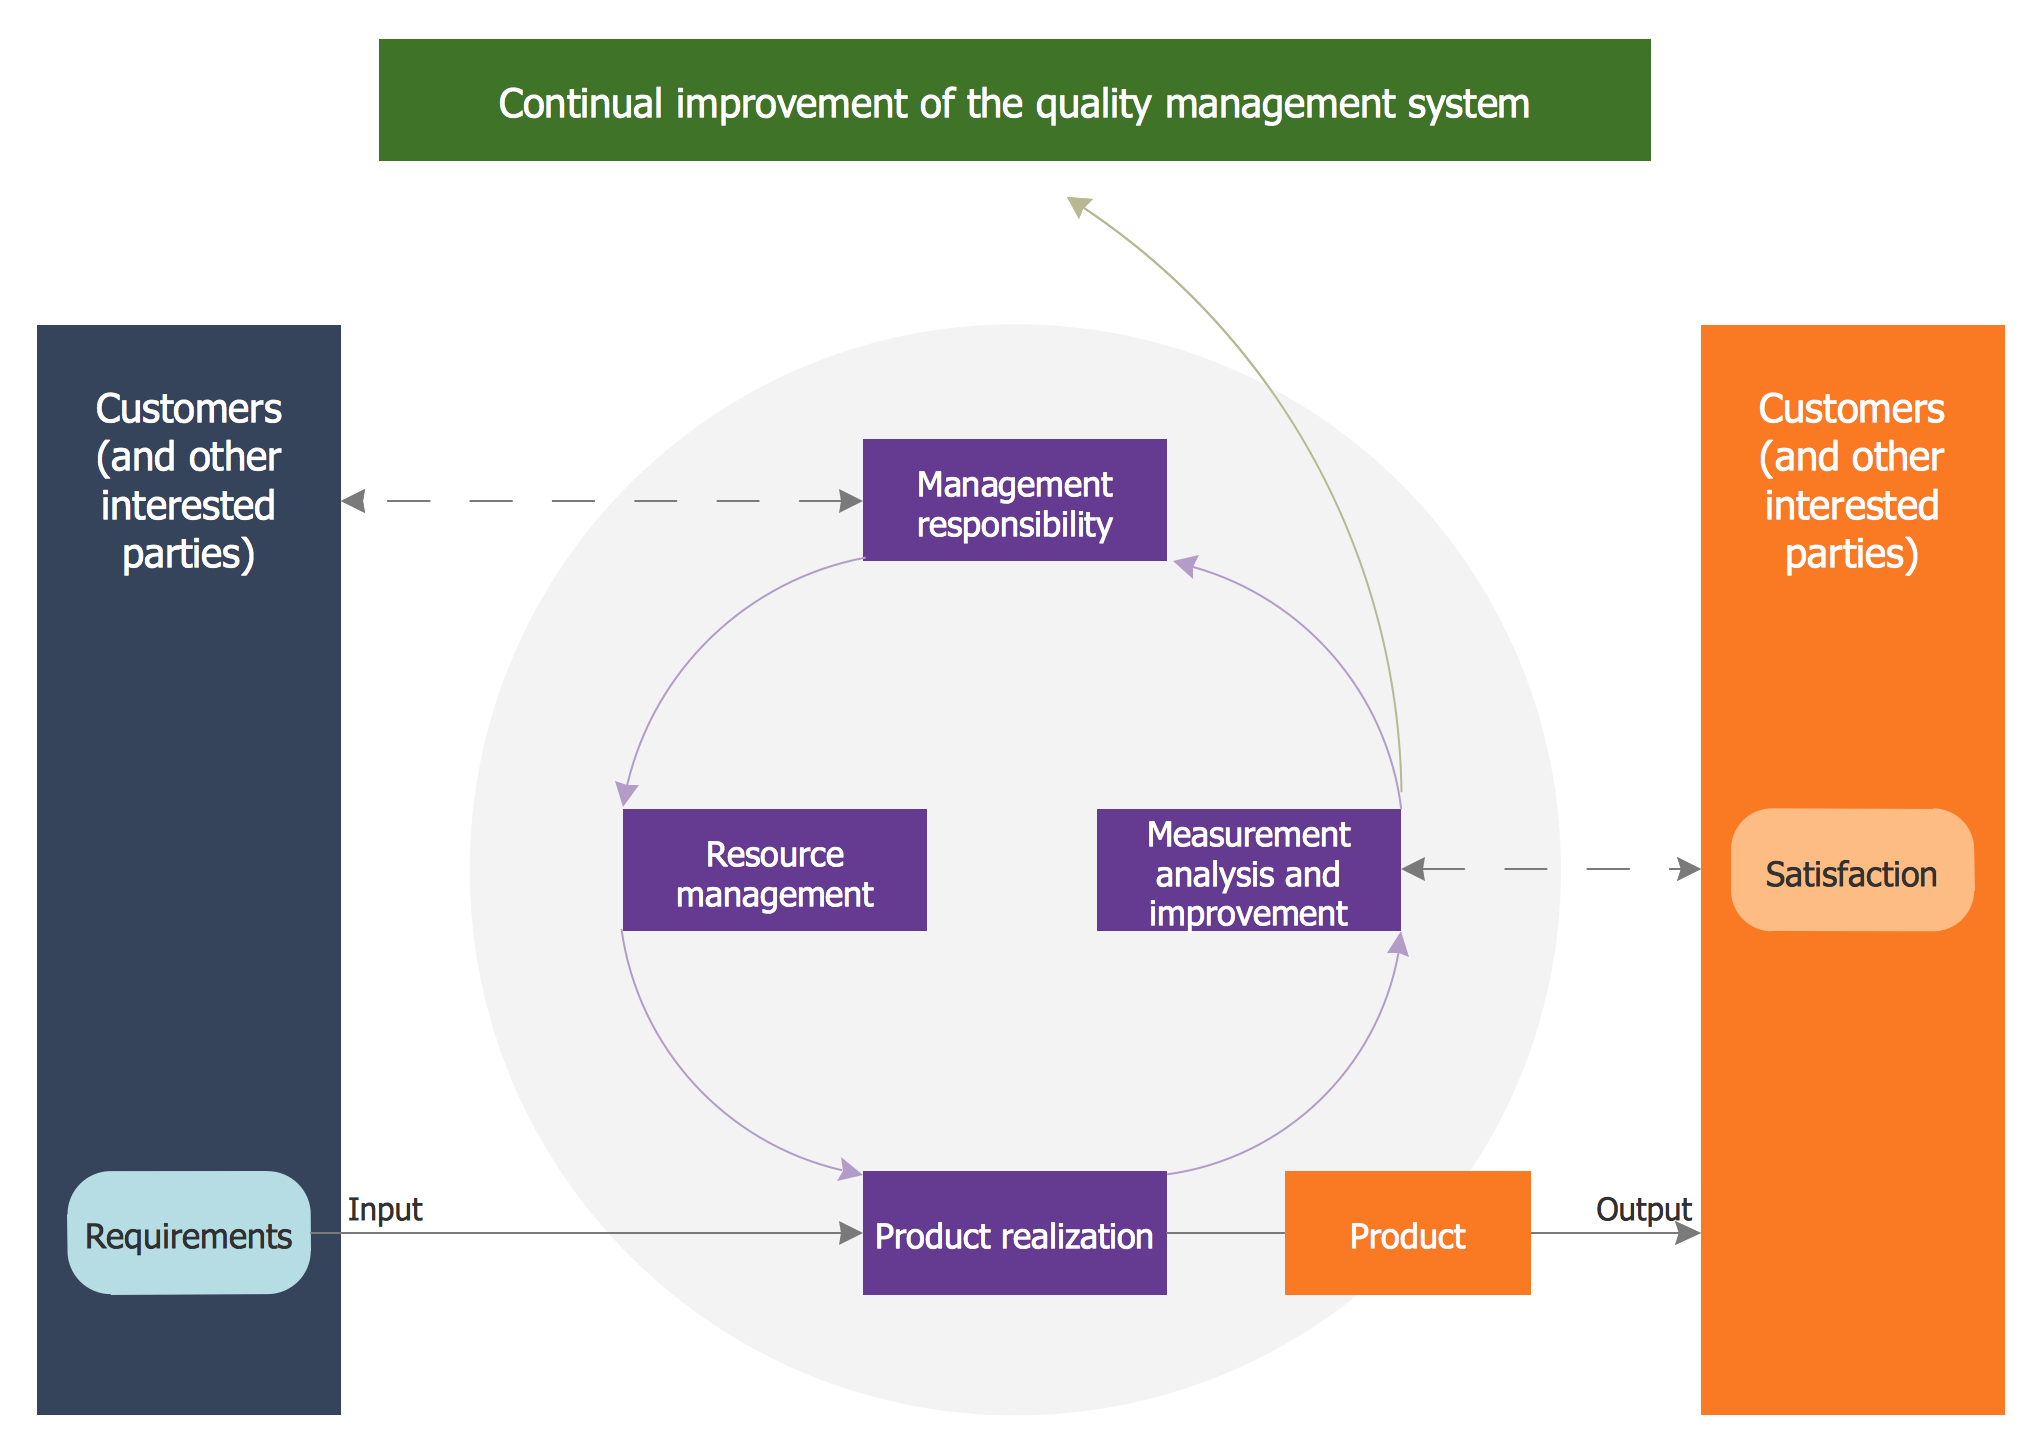
Quality Management System
 Enterprise Architecture Diagrams
Enterprise Architecture Diagrams solution extends ConceptDraw DIAGRAM software with templates, samples and library of vector stencils for drawing the diagrams of enterprise architecture models.
Gane Sarson Diagram

The vector stencils library "TQM diagrams" contains 58 TQM symbols. Use it in business process re-engineering, total quality management, continuous improvement, and quality solutions to draw cause-and-effect diagrams, top-down, and cross-functional process flow charts in the ConceptDraw PRO diagramming and vector drawing software extended with the Total Quality Management (TQM) Diagrams solution from the Quality area of ConceptDraw Solution Park.
Transportation

Inbound Goods
Storage

Procedure

Operation

Operation/ Inspection
Issue

Organization Function
2-Part Function

Decision 1 (TQM)
-tqm-diagrams---vector-stencils-library.png--diagram-flowchart-example.png)
Decision 2 (TQM)
-tqm-diagrams---vector-stencils-library.png--diagram-flowchart-example.png)
Multi in/out Decision (Multi-Input on right)
-tqm-diagrams---vector-stencils-library.png--diagram-flowchart-example.png)
Multi in/out Decision (Multi-Input on left)
-tqm-diagrams---vector-stencils-library.png--diagram-flowchart-example.png)
External Organization

External Process

Inspection/Measurement

Metric

2-part metric

System Database
System Support

System Function

Delay

Connector (TQM)
-tqm-diagrams---vector-stencils-library.png--diagram-flowchart-example.png)
Off-Page Reference

Connected Issues

Fabrication (black)
-tqm-diagrams---vector-stencils-library.png--diagram-flowchart-example.png)
Fabrication (white)
-tqm-diagrams---vector-stencils-library.png--diagram-flowchart-example.png)
Move (black)
-tqm-diagrams---vector-stencils-library.png--diagram-flowchart-example.png)
Move (white)
-tqm-diagrams---vector-stencils-library.png--diagram-flowchart-example.png)
Store (black)
-tqm-diagrams---vector-stencils-library.png--diagram-flowchart-example.png)
Store (white)
-tqm-diagrams---vector-stencils-library.png--diagram-flowchart-example.png)
Inspection (black)
-tqm-diagrams---vector-stencils-library.png--diagram-flowchart-example.png)
Inspection (white)
-tqm-diagrams---vector-stencils-library.png--diagram-flowchart-example.png)
Selectable Process (All White)
-tqm-diagrams---vector-stencils-library.png--diagram-flowchart-example.png)
Selectable Process ('Fabrication' Black)
-tqm-diagrams---vector-stencils-library.png--diagram-flowchart-example.png)
Selectable Process ('Move' Black)
-tqm-diagrams---vector-stencils-library.png--diagram-flowchart-example.png)
Selectable Process ('Store' Black)
-tqm-diagrams---vector-stencils-library.png--diagram-flowchart-example.png)
Selectable Process ('Inspection' Black)
-tqm-diagrams---vector-stencils-library.png--diagram-flowchart-example.png)
Work Flow Loop 1
Work Flow Loop 2
Feedback Arrow
X-Function - Vertical

X-Function - Horizontal

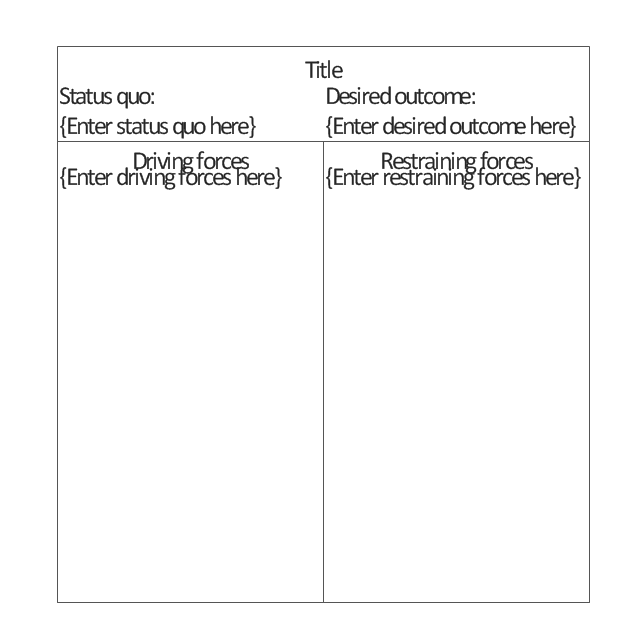
Force-Field Analysis
Cause 1
Cause 2
Cause 3
Category
Effect
Fish Frame

Dynamic Connector
Result
No Result

Branch: Return
Branch: No Return

Interrupt

External Control

Refinement

 Object-Role Modeling (ORM) Diagrams
Object-role Modeling (ORM) Diagram solution with powerful vector diagramming and data modeling tools, large quantity of specially developed samples and examples, and rich variety of vector objects corresponding to common ORM notation, ideally suits for developing the comprehensive, clear and visual Object-role Modeling (ORM) diagrams and schematics, understandable for all interested people from the different fields and business directions, for designing the ORM models, and demonstrating advantages from the use of ORM and its notation. It is intended for software developers and computer engineers, specialists in a field of Object-oriented programming (OOP), database architects, web-application constructors and developers, etc.
Process Flowchart


How to Build Cloud Computing Diagram Principal Cloud Manufacturing

 Website Wireframe
The innovative Website Wireframe solution enhances the ConceptDraw DIAGRAM functionality with newest wireframe tools, libraries with variety of predesigned icons, symbols, buttons, graphics, forms, boxes, and many other vector elements, templates and professionally designed samples, which make it the best wireframing software. Website Wireframe solution gives you significant advantages when designing and maintaining websites, creating skeletal and content-free depictions of website structure, making website prototypes and planning the content arrangement before committing to design, also speeds up the processes of sketching, producing and sharing wireframe examples of website style and interface design.
 PM Easy
PM Easy solution extends the ConceptDraw PROJECT functionality with an ability to support neutral methodology of project management and to quickly start a project by listing the task relationships and dependencies, that makes the iterative planning much easier. The project management tool and available visual tools, such as mind mapping, increase the effectiveness of tracking and analysis your project tasks. PM Easy solution from ConceptDraw Solution Park is mainly targeted at project managers in small or medium-sized companies, allowing them to make the project plan and execute projects using mind mapping technique, to implement planning using mind mapping, and to track tasks using ConceptDraw PROJECT application.
- Framework Of Total Quality Management With Diagram
- Block Diagram Of Tqm Framework
- Communication Framework For Tqm
- Total Quality Management Framework Ppt
- Total Quality Management TQM Diagrams | Acid sulfate soil ...
- Acid sulfate soil adaptive management framework | Produce ...
- Balance Sheet Flow Chart
- Total Quality Management with ConceptDraw | Event-driven Process ...
- Total Quality Management TQM Diagrams | Business diagrams ...
- Basic Flowchart Symbols and Meaning | Design elements - TQM ...