This site uses cookies. By continuing to browse the ConceptDraw site you are agreeing to our Use of Site Cookies.

Best Mind Mapping Program for Making Presentations

ConceptDraw MINDMAP with the ability to import presentations from Microsoft PowerPoint, as well as enhancing its existing presentation capabilities.

Create a Presentation Using a Design Template

The intuitive interface of ConceptDraw MINDMAP and the Functional Tools overview below will guide you in creating and demonstrating powerful mind map presentations using template.
An advanced tool allows you effectively generate, change, and update your presentation.

Organizational Chart Templates

ConceptDraw offers you a number of ready-made organizational chart templates which you can use in your drawing. They are grouped in topical sets as organizational chart template files.
Use the Organizational Charts Solution for ConceptDraw DIAGRAM to create your own Organizational Charts of any complexity quick, easy and effective.
The Organizational Charts designed with ConceptDraw DIAGRAM are vector graphic documents and are available for reviewing, modifying, converting to a variety of formats (image, HTML, PDF file, MS PowerPoint Presentation, Adobe Flash or MS Visio XML), printing and send via e-mail in one moment.
How to draw an Organizational Chart

How to Create a Great Presentation

Create great presentations with ConceptDraw easily.

Fishbone Diagram Template

A causal model is an abstract concept, that describes the causal mechanisms of a system, by noting certain variables and their influence on each other, in an effort to discover the cause of a certain problem or flaw. This model is presented in diagram form by using a fishbone diagram.
ConceptDraw DIAGRAM diagramming and vector drawing software enhanced with Fishbone Diagrams solution helps you create business productivity diagrams from Fishbone diagram templates and examples, that provide to start using of the graphic method for the analysis of problem causes. Each predesigned Fishbone Diagram template is ready to use and useful for instantly drawing your own Fishbone Diagram.

Process Flowchart

ConceptDraw is Professional business process mapping software for making process flow diagram, workflow diagram, general flowcharts and technical illustrations for business documents. It is includes rich examples, templates, process flowchart symbols. ConceptDraw flowchart maker allows you to easier create a process flowchart. Use a variety of drawing tools, smart connectors, flowchart symbols and shape libraries to create flowcharts of complex processes, process flow diagrams, procedures and information exchange.
How To Create a Process Flow Chart (business process modelling techniques)

How To use House Electrical Plan Software

House Electrical Plan Software for creating great-looking home floor, electrical plan using professional electrical symbols.
You can use many of built-in templates, electrical symbols and electical schemes examples of our House Electrical Diagram Software.
ConceptDraw is a fast way to draw: Electrical circuit diagrams, Schematics, Electrical Wiring, Circuit schematics, Digital circuits, Wiring in buildings, Electrical equipment, House electrical plans, Home cinema, Satellite television, Cable television, Closed-circuit television.
House Electrical Plan Software works across any platform, meaning you never have to worry about compatibility again. ConceptDraw DIAGRAM allows you to make electrical circuit diagrams on PC or macOS operating systems.
Create an Electrical Diagram

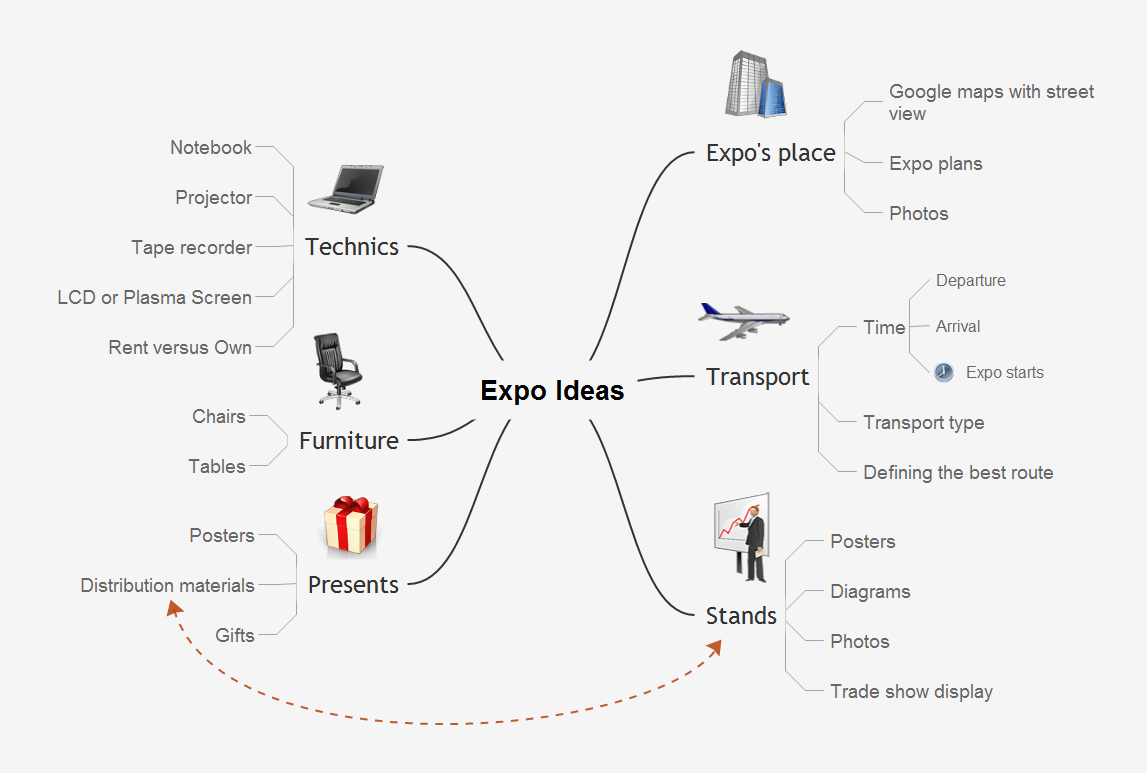
How To Do A Mind Map In PowerPoint

ConceptDraw MINDMAP - an excellent tool for exporting mind maps to PowerPoint to visualize and presenting your project. You can simply generate, change, update your mindmap and then make a presentation in PowerPoint.

Pie Chart Examples and Templates

A pie chart or a circle graph is a circular chart divided into sectors, illustrating numerical proportion. In a pie chart, the arc length of each sector and consequently its central angle and area, is proportional to the quantity it represents.

Pie chart examples and templates created using ConceptDraw DIAGRAM software helps you get closer with pie charts and find pie chart examples suite your needs.

wireframe tools, wireframing, wire frame, website wireframe, interface design, wireframe examples Website Wireframe

wireframe tools, wireframing, wire frame, website wireframe, interface design, wireframe examples
The innovative Website Wireframe solution enhances the ConceptDraw DIAGRAM functionality with newest wireframe tools, libraries with variety of predesigned icons, symbols, buttons, graphics, forms, boxes, and many other vector elements, templates and professionally designed samples, which make it the best wireframing software. Website Wireframe solution gives you significant advantages when designing and maintaining websites, creating skeletal and content-free depictions of website structure, making website prototypes and planning the content arrangement before committing to design, also speeds up the processes of sketching, producing and sharing wireframe examples of website style and interface design.