 Fishbone Diagram
Fishbone Diagrams solution extends ConceptDraw PRO software with templates, samples and library of vector stencils for drawing the Ishikawa diagrams for cause and effect analysis.
Sales KPI Dashboards
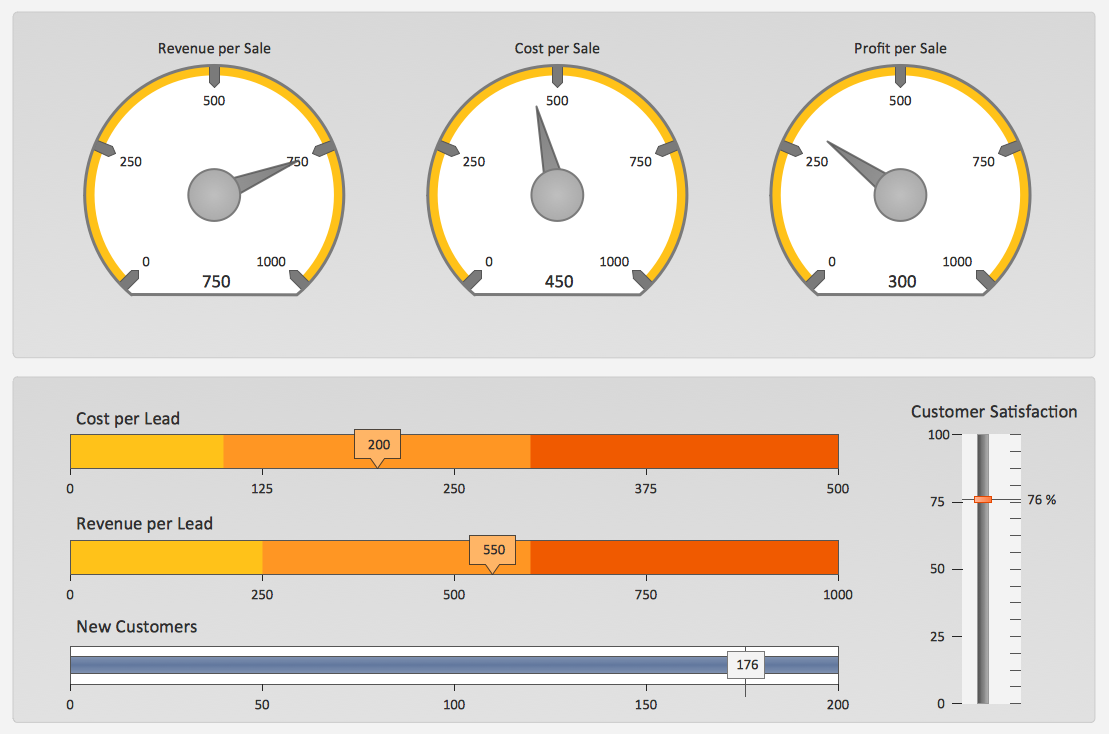
A combination of sales KPI on a one dashboard helps you track sales activities and results. Visualizing sales data using ConceptDraw PRO software extended with the Sales Dashboard solutiongives you flexibility in choosing and tuning KPIs.
 ConceptDraw Solution Park
ConceptDraw Solution Park collects graphic extensions, examples and learning materials
 Management
This solution extends ConceptDraw PRO v9 and ConceptDraw MINDMAP v7 with Management Diagrams and Mind Maps (decision making, scheduling, thinking ideas, problem solving, business planning, company organizing, SWOT analysis, preparing and holding meetings
 PM Response
This solution extends all ConceptDraw Office 2.0 products by helping to improve the response time to project changes. PM Response also helps with iteration planning, discussing project layout approaches, and solving project challenges.
 Sales Dashboard
Sales Dashboard solution extends ConceptDraw PRO software with templates, samples and library of vector stencils for drawing the visual dashboards of sale metrics and key performance indicators (KPI).
 Marketing
This solution extends ConceptDraw PRO v9 and ConceptDraw MINDMAP v7 with Marketing Diagrams and Mind Maps (brainstorming, preparing and holding meetings and presentations, sales calls).
 Entity-Relationship Diagram (ERD)
Entity-Relationship Diagram (ERD) solution extends ConceptDraw PRO software with templates, samples and libraries of vector stencils from drawing the ER-diagrams by Chen's and crow’s foot notations.
 Value Stream Mapping
Value stream mapping solution extends ConceptDraw PRO software with templates, samples and vector stencils for drawing the Value Stream Maps (VSM) in lean manufacturing practice.
 Seven Management and Planning Tools
Seven Management and Planning Tools solution extends ConceptDraw PRO and ConceptDraw MINDMAP with features, templates, samples and libraries of vector stencils for drawing management mind maps and diagrams.
 ConceptDraw Solution Park
ConceptDraw Solution Park collects graphic extensions, examples and learning materials
 Data Flow Diagrams (DFD)
Data Flow Diagrams solution extends ConceptDraw PRO software with templates, samples and libraries of vector stencils for drawing the data flow diagrams (DFD).
 Physics
Physics solution extends ConceptDraw PRO software with templates, samples and libraries of vector stencils for drawing the physical illustrations, diagrams and charts.
 Venn Diagrams
Venn Diagrams are actively used to illustrate simple set relationships in set theory and probability theory, logic and statistics, mathematics and computer science, linguistics, sociology, and marketing. Venn Diagrams are also often used to visually summarize the status and future viability of a project.
 Rack Diagrams
Rack Diagrams solution extends ConceptDraw PRO software with samples, templates and libraries of vector stencils for drawing the computer network server rack mounting diagrams.
 Cisco Network Diagrams
Cisco Network Diagrams solution extends ConceptDraw PRO software with samples, templates and libraries of vector stencils for drawing the Cisco computer network diagrams.
 Circle-Spoke Diagrams
Examples of subject areas that are well suited to this approach are marketing, business, products promotion, process modeling, market, resource, time, and cost analysis. Circle-Spoke Diagrams are successfully used in presentations, conferences, management documents, magazines, reportages, reviews, reports, TV, and social media.
 Circular Arrows Diagrams
Circular Arrows Diagrams solution extends ConceptDraw PRO v10 with extensive drawing tools, predesigned samples, Circular flow diagram template for quick start, and a library of ready circular arrow vector stencils for drawing Circular Arrow Diagrams, Segmented Cycle Diagrams, and Circular Flow Diagrams. The elements in this solution help managers, analysts, business advisers, marketing experts, scientists, lecturers, and other knowledge workers in their daily work.
- TQM Diagram Tool | Marketing Diagrams | Sales KPI Dashboards |
- Fishbone Diagram | Sales KPI Dashboards | Marketing |
- Fishbone Diagrams
- Fishbone Diagram | Design Element for Fishbone Diagram | Entity ...
- Fishbone Diagram | Marketing Diagrams | Business diagrams & Org ...
- Business Productivity Diagramming | Fishbone Diagram | Fishbone ...
- Fishbone Diagram | Marketing | Sales KPI Dashboards |
- Block diagram - Selling technology patent process | Relations ...
- Business Productivity Diagramming | Fishbone Diagram ...
- Business Productivity Diagramming | Fishbone Diagram Software for ...
- Service 8 Ps fishbone diagram template - Conceptdraw.com
- Management | Total Quality Management Business Diagram | Total ...
- Fishbone Diagram | Business Productivity Diagramming | Business ...
- Fishbone Diagrams | Biology | PM Response |
- Business Process Diagram | Fishbone Diagram | Marketing and ...
- Fishbone Diagram | Business diagrams & Org Charts with ...
- Fishbone Diagrams | PM Response | Physics |
- Fishbone Diagram | Business Productivity Diagramming | Business ...
- Radial Tasks Diagram
- Fishbone Diagram | Engineering | Chemical and Process ...
