Infographics Free Software
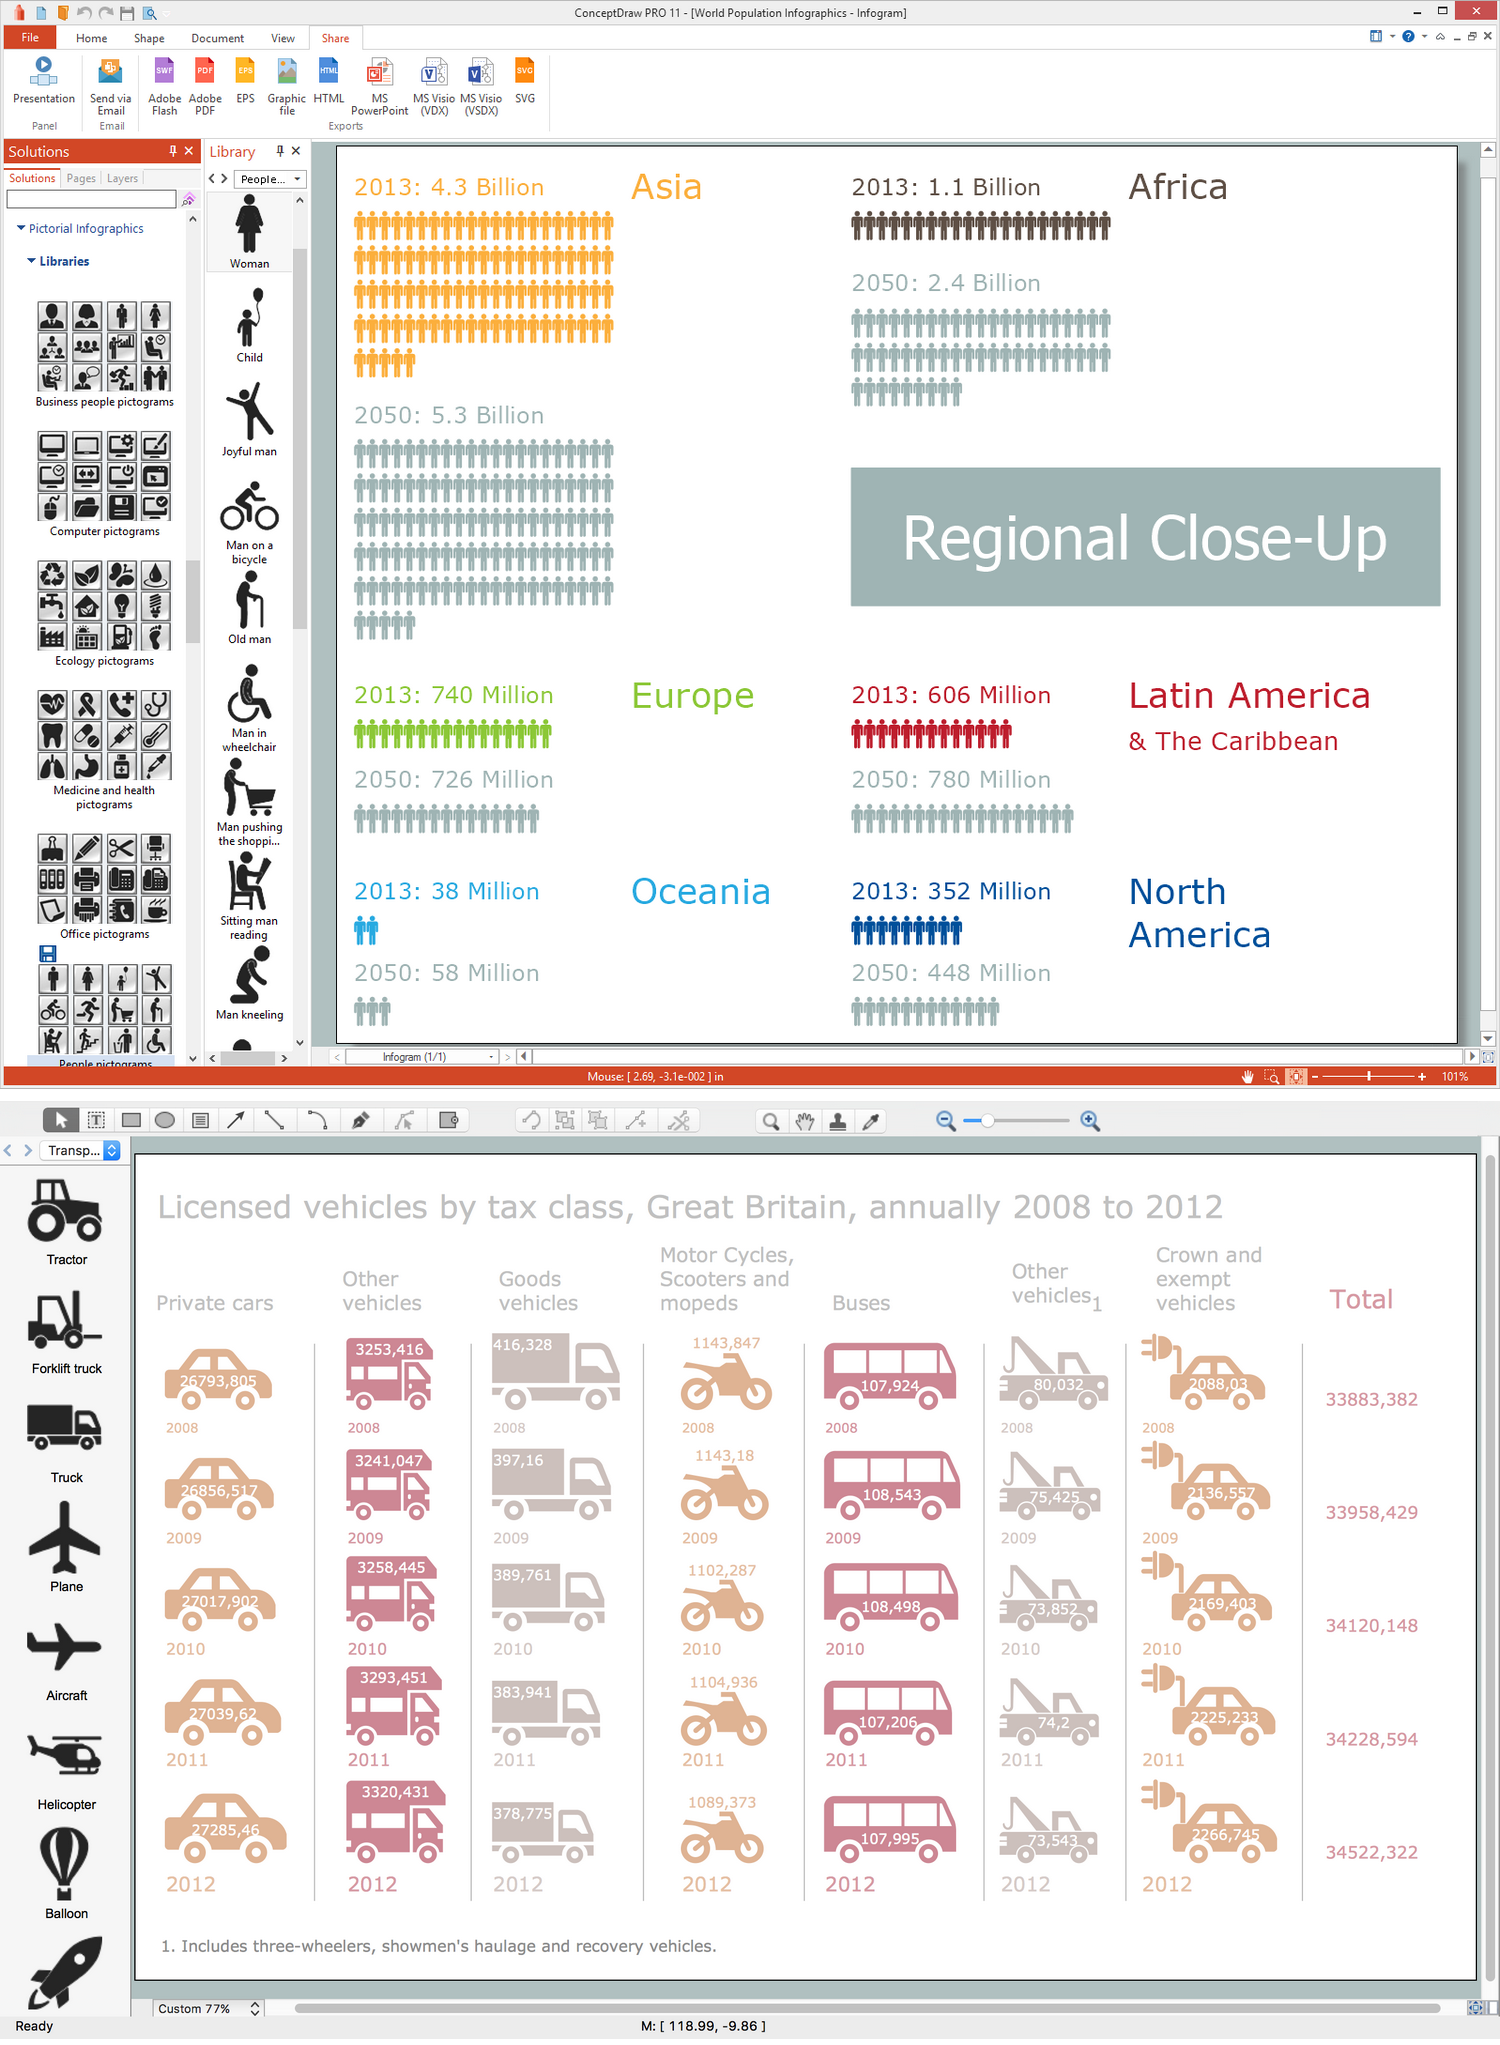
Organize your information efficiently in an infographic with the help of powerful ConceptDraw DIAGRAM software and a set of free infographic solutions Typography Infographics, Pictorial Infographics, Data-driven Infographics, Spatial Infographics, and others. Infographics free software helps to communicate complex information in an eye-catching and engaging way. Visual elements like graphs and charts help to simplify and summarize complex information, facilitate comparison and identification of patterns, trends, and differences, increase engagement and attention, and make it easier to understand and memorize for the audience. Use the predesigned vector elements from the solutions libraries to save time and design without effort professionally looking infographics.Good Flow Chart app for Mac
The ConceptDraw DIAGRAM is a good flow chart app for Mac. Numerous vector stencils, samples and templates created by designers allows you to draw any type of flowchart.Infographic Software
ConceptDraw DIAGRAM extended with Pictorial Infographics Solution from the “Infographics” Area is a powerful Infographic Software. Make sure in it right now!Economy Infographics
The Economy Infographics solution provides a large collection of vector icon libraries, drawing samples and infographic examples for quick and simple design of the best infographics, illustrations, and presentations about economics, markets, economic policy, business, finances, government and social institutions, production, distribution, and consumption of goods and services, economic diagrams and schemes, economic activities designs, continent and country economic maps, economic presentations, market economy and economic system infographic charts, illustrations in economic articles, reports in mass media, and blog posts in social media. It is a valuable tool for wide range of economists, politicians, managers, marketing experts, business analysts, journalists and bloggers focusing on economy, educators and students studying economics, and many other people to communicate visually the economic information.
ConceptDraw Solution Park
ConceptDraw Solution Park collects graphic extensions, examples and learning materials
Selecting & Creating Flowcharts
ConceptDraw Flowcharts visualize a process or algorithm of program as step/operation blocks of various shapes connected with arrowed lines showed the process flow direction. They are used to visualize business or technical processes and software algorithms.Spatial Infographics
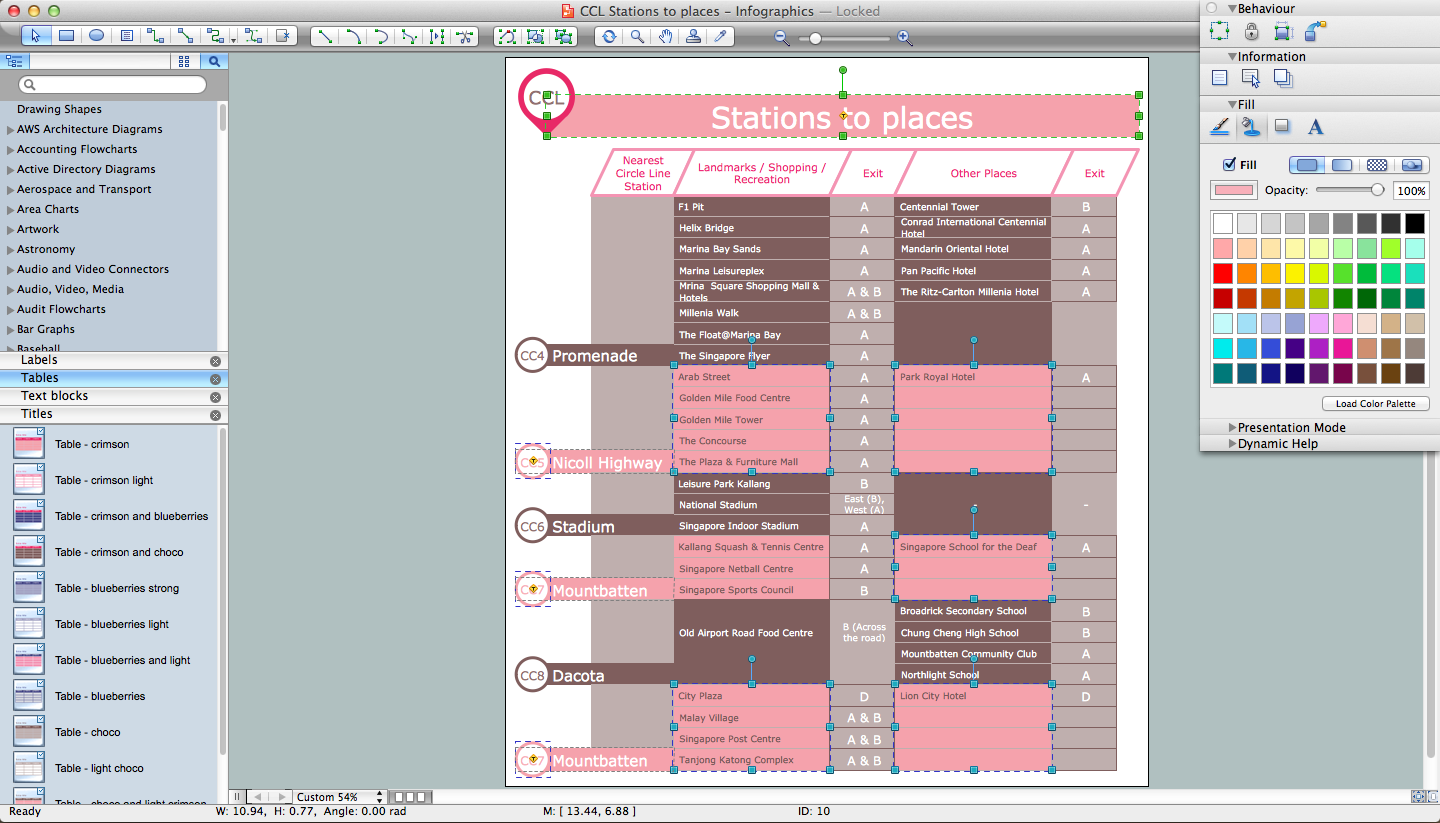
Spatial infographics solution extends ConceptDraw DIAGRAM software with infographic samples, map templates and vector stencils libraries with design elements for drawing spatial information graphics.
Energy Industry Infographics
Energy Industry Infographics solution is ideal for designing energy-related business infographics, diagrams, charts, illustrations for documents and presentations. It provides a set of libraries with special vector energy industry symbols, icons for electrical power industry, nuclear power industry, fossil fuel industry, and renewable energy industry, energy icons of fuel gas, liquid fuel, solid fuel, industry icons of electrical substations, power plants. Collection of samples including nuclear fuel cycle and energy distribution schematics, electrical substation diagram, energy intelligence dashboard, electricity grid schematics, and many more is also included. This solution is indispensable for all engineers, chefs, managers, marketers, and other professionals working in energy industry.
Politics Infographics
ConceptDraw DIAGRAM extended with a Politics Infographics solution is an effective way to design political infographics, diagrams, presentations, illustrations, and other materials on the political topics, depicting political news, outlining the main points of countries’ foreign policy, identity politics, and points of programs of political parties, illustrate and present political polls results. The solution offers a huge collection of predesigned vector objects and illustrative samples in political science.
Mass Media Infographics
Mass Media Infographics solution supplies ConceptDraw DIAGRAM with professional drawing tools, samples and high-quality vector stencils libraries for fast and convenient designing impressive mass media content, social media and mass media infographics, diagrams, illustrations, schematics, and presentation slides. It will be useful for media people, bloggers, journalists, professionals and students in the area of mass communication, specialists in social media marketing, social media management, digital media marketing, broadcasting, publishing, and online advertising. Easily design the magnificent mass media infographics with Mass Media Infographics solution to interact effectively with your target audience through social platforms like Facebook, Instagram, Twitter, Pinterest. Share them on websites and social media sites, take likes and get into the top in media charts!
Travel Infographics
Travel Infographics solution greatly extends the ConceptDraw DIAGRAM functionality making it the best travel infographics design software. Being intended for all specialists in the travel sphere, travel agents, marketers, advertisers, PR specialists, travelers and all other people related with tourism and rest, it contains professionally-designed samples, travel infographics template, and libraries with large variety of ready-made travel infographic vector clipart, design objects and travel infographics icons for drawing exceptional travel infographics and business travel infographics, travel illustrations, presentations, diagrams, schematics, plans, maps, posters, billboards, advertising, marketing, and other materials on the subject of travel and tourism, outdoor activities and extreme sports.
Oil and Gas
The Oil and Gas solution for ConceptDraw DIAGRAM software provides vector libraries of oil and gas symbols and a collection of samples for quick and simple designing of the oil and gas industry infographics, illustrations, presentations, diagrams. The resulting oil and gas graphics and illustrations help to clearly and quickly detail complex information. They are ideal for reporting on the development of best practices in oil and gas exploration and production. Use them to illustrate growth strategies and trends in the oil industry, conduct analysis, forecast the energy industry, and present the results of international energy forums.
Food Court
Use the Food Court solution to create food art. Pictures of food can be designed using libraries of food images, fruit art and pictures of vegetables.
- Typography Infographic Software | Free Infographics Tools Downloads
- Infographic Software | Free Infographic Software
- Spatial infographics Design Elements: Continental Map | Map ...
- Infographic Maker - software tools | Free Infographics Creation Sites
- Infographic Tools | Transportation Infographics | Free Infographic Tools
- Subway infographic design elements - software tools | Map ...
- Spatial Infographics | Basic Pie Charts | Best Flowcharts | Free Trial ...
- Map Infographic Maker | Map Infographic Tool | Free Infographic ...
- Map Infographic Tool | Free Infographic Creation Sites