 Line Graphs
How to draw a Line Graph with ease? The Line Graphs solution extends the capabilities of ConceptDraw PRO v10 with professionally designed templates, samples, and a library of vector stencils for drawing perfect Line Graphs.
HelpDesk
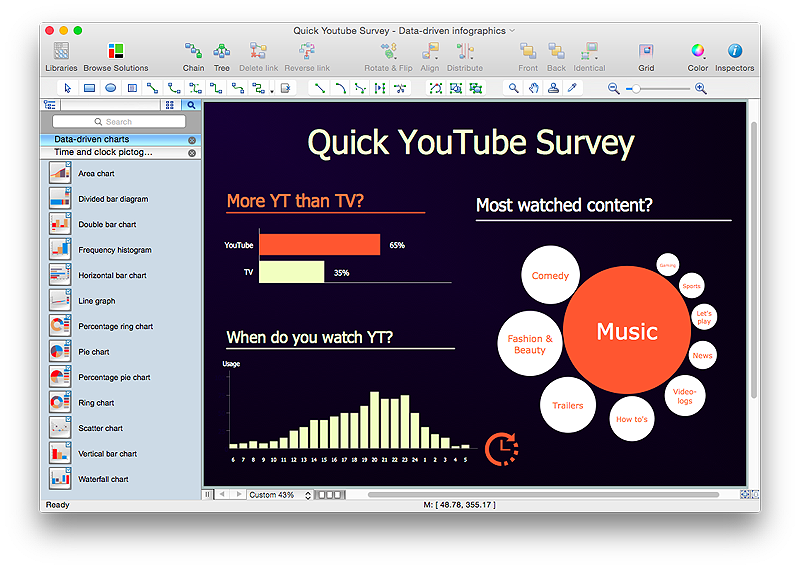
How to Create Data-driven Infographics
Data-driven infographics are used in wildly disparate areas of business and commerce. To make effective Data-driven infographics, it's useful to have a wide variety of graphical elements — icons, clipart, stencils, charts and graphs — to illustrate your diagram. ConceptDraw Data-driven Infographics solution provides all the tools you need to present data as described by this article — as well as the charts mentioned previously, you can find histograms, divided bar charts, ring charts, line graphs and area charts — meaning you can find the perfect medium for displaying a certain type of data. It allows you to draw data driven infographics quickly and easily using the special templates and vector stencils libraries.It can be used to quickly communicate a message, to simplify the presentation of large amounts of data, to see data patterns and relationships, and to monitor changes in variables over time.
 Plant Layout Plans
This solution extends ConceptDraw PRO v.9.5 plant layout software (or later) with process plant layout and piping design samples, templates and libraries of vector stencils for drawing Plant Layout plans. Use it to develop plant layouts, power plant desig
 Picture Graphs
Typically, a Picture Graph has very broad usage. They many times used successfully in marketing, management, and manufacturing. The Picture Graphs Solution extends the capabilities of ConceptDraw PRO v10 with templates, samples, and a library of professionally developed vector stencils for designing Picture Graphs.
 Bar Graphs
The Bar Graphs solution enhances ConceptDraw PRO v10 functionality with templates, numerous professional-looking samples, and a library of vector stencils for drawing different types of Bar Graphs, such as Simple Bar Graph, Double Bar Graph, Divided Bar Graph, Horizontal Bar Graph, Vertical Bar Graph, and Column Bar Chart.
 Sport Field Plans
Construction of sport complex, playgrounds, sport school, sport grounds and fields assumes creation clear plans, layouts, or sketches. In many cases you need represent on the plan multitude of details, including dimensions, placement of bleachers, lighting, considering important sport aspects and other special things.
HelpDesk
How to Create Education Infographics
Education Infographics is used to display a lot of education-related information in a single, visually-appealing graphic. Infographics, created for education purposes can contain different illustrations, detailed charts, and data. ConceptDraw PRO can be used as a tool for creating education infographics. It allows you to draw infographics quickly and easily using the special templates and vector stencils libraries. Infographics can be used to quickly communicate a message, to simplify the presentation of large amounts of data, to see data patterns and relationships, and to monitor changes in variables over time. It can contain bar graphs, pie charts, histograms, line charts, e.t.c.- Chart Maker for Presentations | Sales Growth. Bar Graphs Example ...
- Free Online Chart Maker
- Free Line Graph Templates
- Free Powerpoint Graphs
- Create Graphs and Charts | Selecting & Creating Flowcharts ...
- Chart Maker Online
- Line Graph
- Basic Diagramming | Block Diagram Creator | Block Diagram ...
- Line Chart | Basic Diagramming | Line Chart Template for Word ...
- Chart Maker for Presentations | Bar Chart Software | Line Chart ...
- Create Graphs and Charts | Sales Growth. Bar Graphs Example ...
- Bar Chart Software | Chart Maker for Presentations | Line Chart ...
- Bar Chart Software | Line Chart Template for Word | Chart Maker for ...
- Line graph template
- Line Chart Template for Word | Chart Maker for Presentations | Line ...
- Bar Graphs | Line Graphs | Picture Graphs | Graphs
- Graph Generator Online
- Chart Maker for Presentations | Picture Graphs | Chart Software for ...
- Line Graphs | Line Graph Charting Software | Chart Maker for ...
- Line Graphs | Line Graph Charting Software | How to Draw a Line ...

