Basic Flowchart Symbols and Meaning
Flowcharts are the best for visually representation the business processes and the flow of a custom-order process through various departments within an organization. ConceptDraw PRO diagramming and vector drawing software extended with Flowcharts solution offers the full set of predesigned basic flowchart symbols which are gathered at two libraries: Flowchart and Flowcharts Rapid Draw. Among them are: process, terminator, decision, data, document, display, manual loop, and many other specific symbols. The meaning for each symbol offered by ConceptDraw gives the presentation about their proposed use in professional Flowcharts for business and technical processes, software algorithms, well-developed structures of web sites, Workflow diagrams, Process flow diagram and correlation in developing on-line instructional projects or business process system. Use of ready flow chart symbols in diagrams is incredibly useful - you need simply drag desired from the libraries to your document and arrange them in required order. There are a few serious alternatives to Visio for Mac, one of them is ConceptDraw PRO. It is one of the main contender with the most similar features and capabilities.
Infographic Software
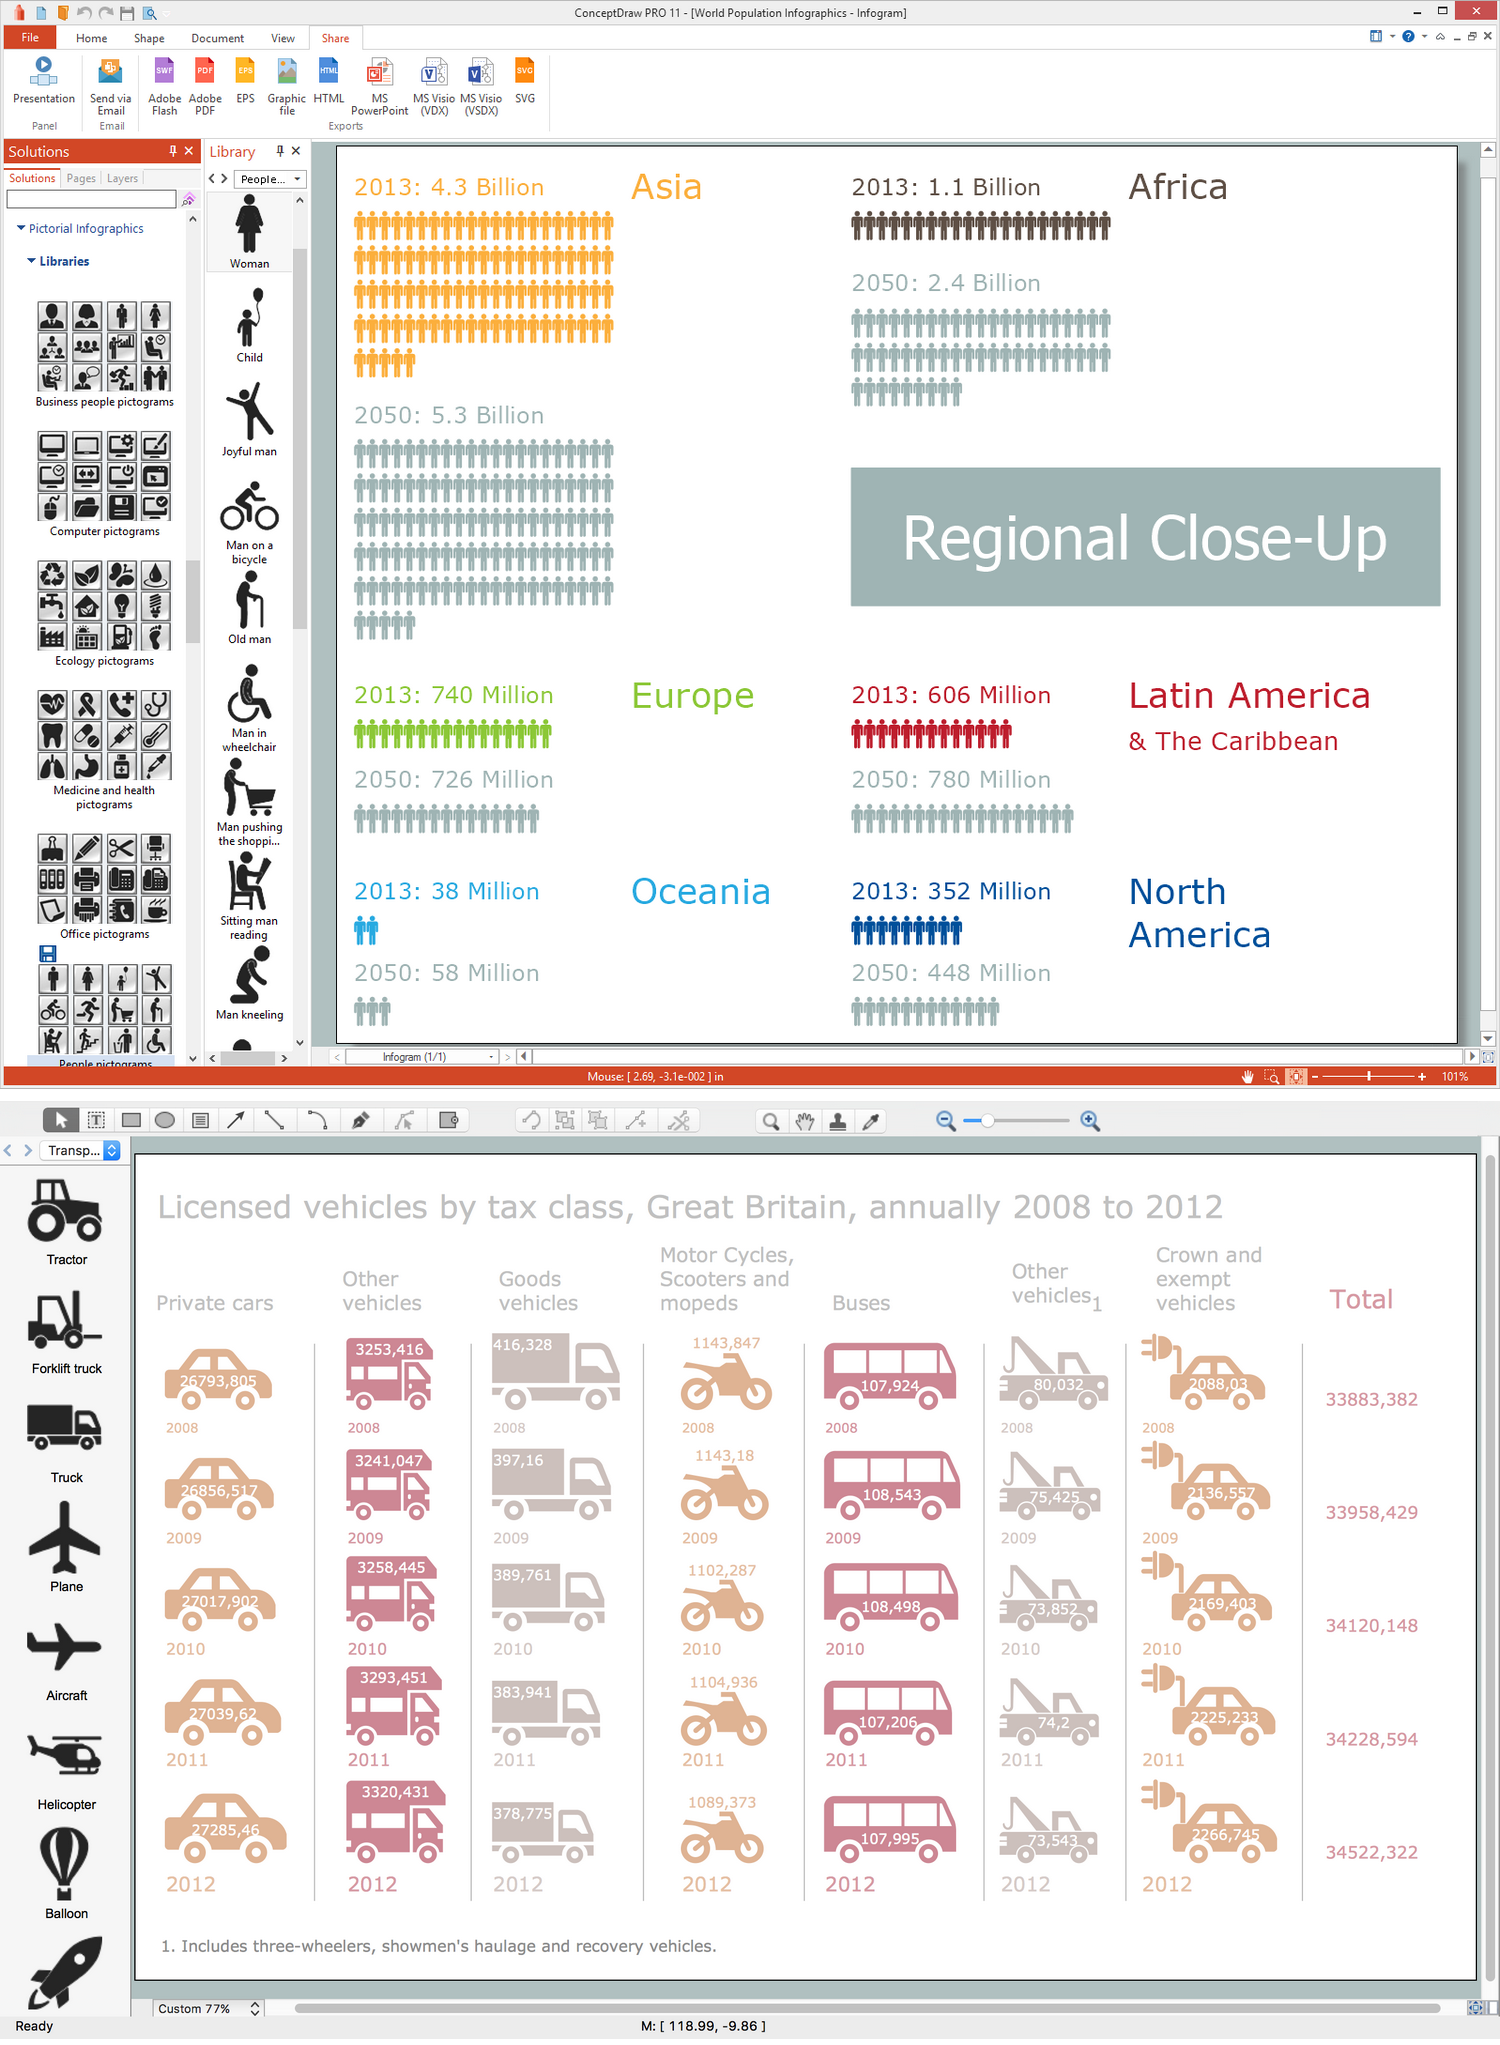
ConceptDraw PRO extended with Pictorial Infographics Solution from the “Infographics” Area is a powerful Infographic Software. Make sure in it right now!Infographic Maker
Infographic is a visual way of representing various information, data, knowledge in statistics, geography, journalism, education, and much more areas. ConceptDraw PRO supplied with Pictorial Infographics Solution from the “Infographics” Area, provides a set of powerful pictorial infographics tools. Thanks to them it is the best Infographic Maker.Biology Drawing Software
Biology is incredibly interesting and useful natural science which studies all living things on the earth (people, animals, plants), structure, functions, interactions, evolution of living organisms. Biologists of the whole world use actively illustrations and drawings in your science and education activity. To facilitate their task of biology drawing, ConceptDraw PRO diagramming and vector drawing software was extended with Biology solution from the Science and Education area. Now, ConceptDraw PRO is a powerful biology drawing software.Chemistry Drawing Software
ConceptDraw PRO extended with Chemistry solution from the Science and Education area is a powerful chemistry drawing software that provides the useful tools to help you design all kinds of chemistry drawings and illustrations, chemical schemes and diagrams of formulas, reaction schemes and lab set-ups of any complexity.UML Diagram Types List
Two types of diagrams are used in UML: Structure Diagrams and Behavior Diagrams. Behavior Diagrams represent the processes proceeding in a modeled environment. Structure Diagrams represent the elements that compose the system.Bubble Chart Maker
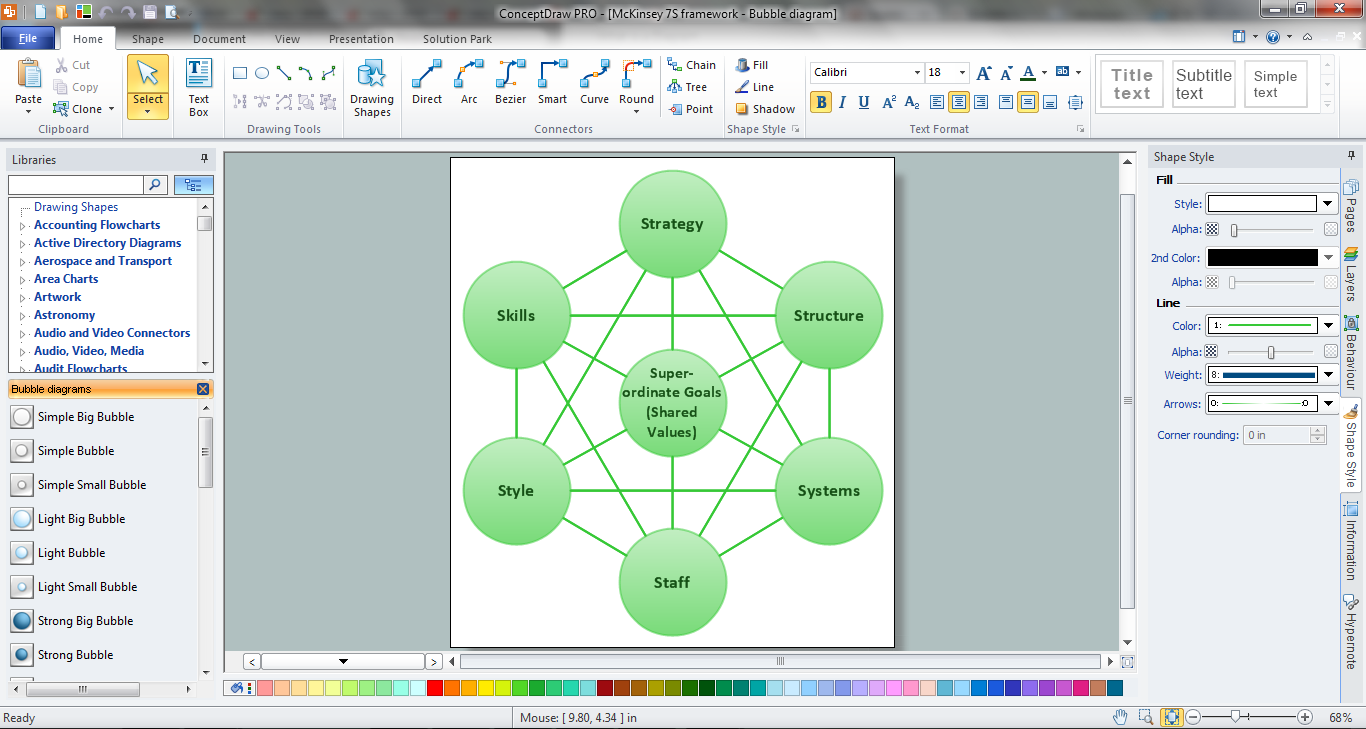
ConceptDraw PRO diagramming and vector drawing software extended with Bubble Diagrams Solution from the "Diagrams" Area is a powerful Bubble Chart Maker.Sketching Software
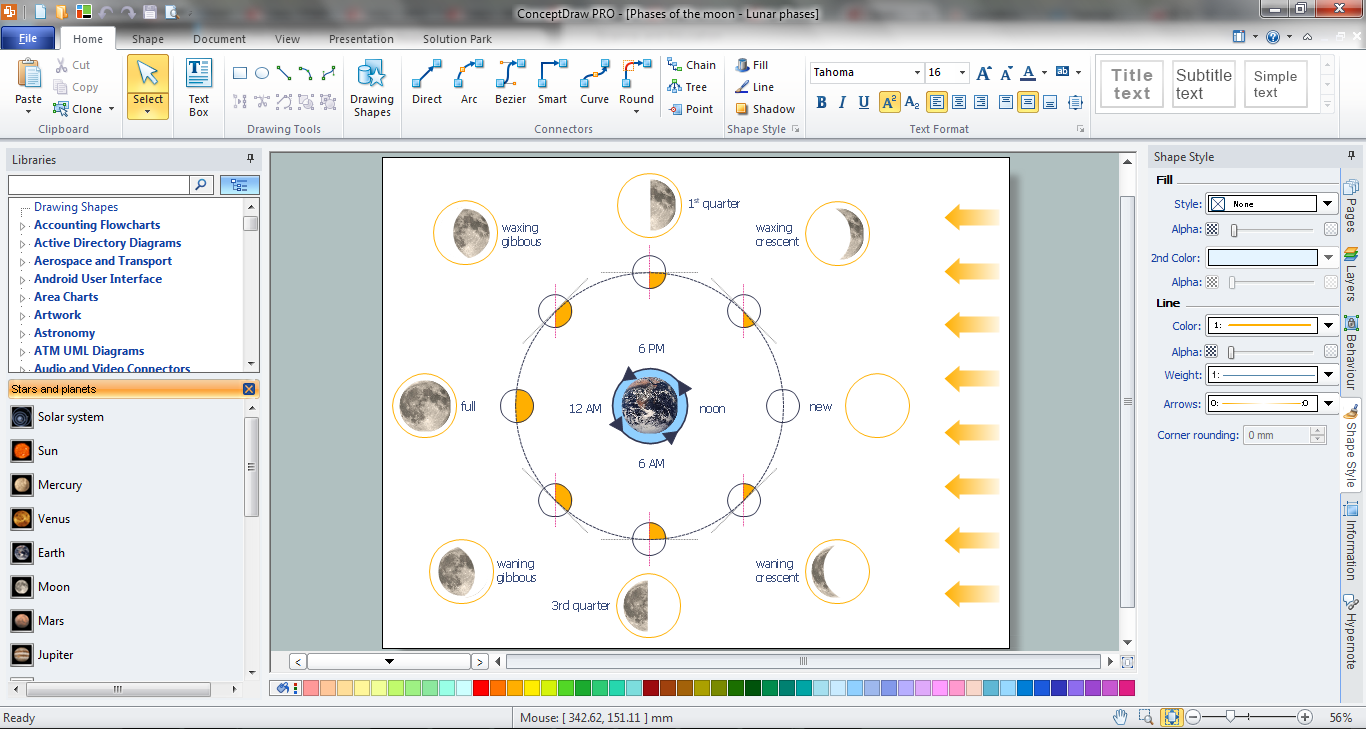
ConceptDraw PRO is a powerful diagramming, vector drawing and sketching software that can be successfully used for creating various sketches, illustrations, drawing in any field of science and life activity. In particular, ConceptDraw PRO offers the Astronomy solution from the Science and Education area to help you design the astronomy pictures, sun solar system drawings, constellation chart quick and easy.Sentence Diagrammer
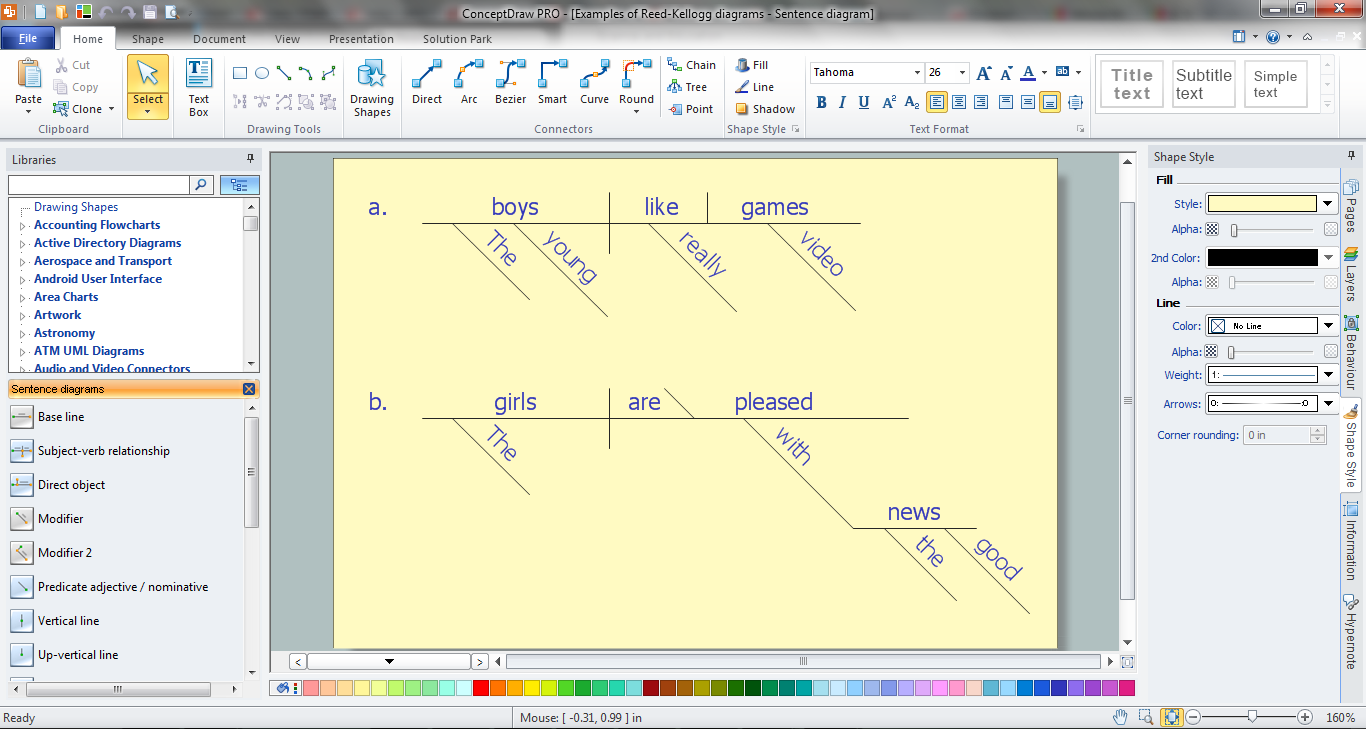
ConceptDraw PRO is a powerful diagramming and vector drawing software. Extended with Language Learning solution from the Science and Education area of ConceptDraw Solution Park it become also effective sentence diagrammer software.Bubble Map Maker
The Bubble Map is a popular tool for visualization a data set which is widely used in economics, medicine, software engineering, architecture, and many other fields. Each bubble on the Bubble Map is characterized by coordinates, color and size. ConceptDraw PRO diagramming and vector drawing software extended with Bubble Diagrams Solution from the "Diagrams" Area is a powerful Bubble Map Maker.UML Class Diagram Notation
When it comes to system construction, a class diagram is the most widely used diagram. UML Class Diagrams is a type of static structure diagram that is used for general conceptual modeling of the systematics of the application. Such a diagram would illustrate the object-oriented view of a system . The object orientation of a system is indicated by a class diagram. It describes the structure of a system by showing the general issues,classes of a system, attributes, operations, interfaces, inheritance, and the relationships between them.Sentence Diagrammer
Sentence a grammatical unit of several words, and provides a narrative, question, comment, etc. It begins with a capital letter and ends with proper punctuation. Sentence diagramming allows you to visually present the sentence part function, which helps you build right sentences. Language Learning solution offers the Sentence Diagrams Library with set of vector stencils for drawing various Sentence Diagrams, for visualizing grammatical structures that will assist you in language learning and construction of grammatically correct sentences. ConceptDraw PRO diagramming software extended with Language Learning solution from the Science and Education area provides the powerful sentence diagraming tools.Illustration Software
No science can't exist without illustrations, and especially astronomy! Illustrations help to visualize knowledge, natural phenomenons which are studied by astronomy, they equally effective help in work, during the learning process and on the conferences. Now we have professional astronomy illustration software - ConceptDraw PRO illustration and sketching software with templates, samples and libraries of a variety of astronomy symbols, including constellations, galaxies, stars, and planet vector shapes; a whole host of celestial bodies. When drawing scientific and educational astronomy illustrations, astronomy pictures and diagrams, can help you reach for the stars!- Design elements - Medicine and health pictograms | Medicine and ...
- Medicine and health pictograms - Vector stencils library | Healthy ...
- Design Pictorial Infographics. Design Infographics | Design ...
- Fire Extinguisher Png
- Hospital Building Png Vector
- Medicine and health pictograms - Vector stencils library | Medicine ...
- Process Flowchart | How to Create Flowcharts for an Accounting ...
- Post Man Png
- Office Layout Plans | Interior Design Office Layout Plan Design ...
- Fuel Png
- Health Food | Social determinants of health | How to Create ...
- Design Pictorial Infographics. Design Infographics | Design ...
- Fire and Emergency Plans | Emergency Plan | How To Create ...
- Plumbing and Piping Plans | Design elements - Bathroom | Home ...
- Design elements
- UML Component Diagram Example - Online Shopping | UML ...
- Emergency Plan | Fire Exit Plan. Building Plan Examples | Fire and ...
- Fire Evacuation Plan Template | How To Create Emergency Plans ...
- Using Fishbone Diagrams for Problem Solving | How to Manage ...
- Floor Plan Of Fire Equipment


