Seven Basic Tools of Quality - Histogram
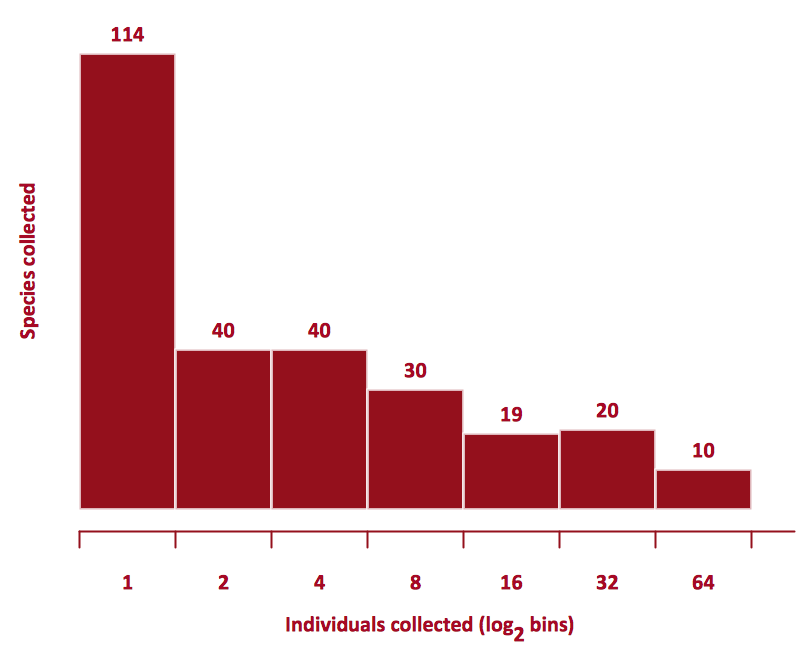
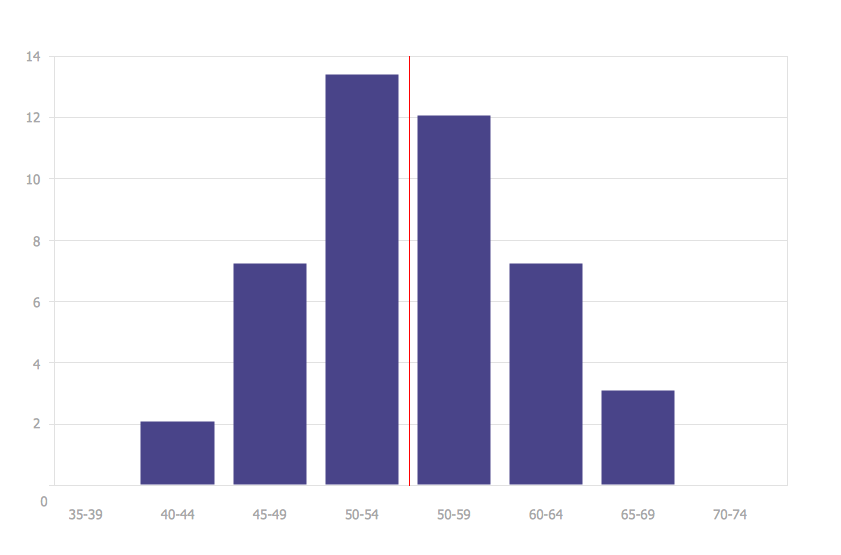
A histogram is a chart which visually displays a distribution of numerical data. ConceptDraw DIAGRAM diagramming and vector drawing software offers a powerful Seven Basic Tools of Quality solution from the Quality area of ConceptDraw Solution Park which contains a set of useful tools for easy drawing Histogram and other quality related diagrams of any complexity.How Do You Make a Histogram?
How do you make a histogram usually? Drawing of histogram is quite complex and lengthy process. Usually you have a set of data and you draw free-hand your diagram according to these data. But now thanks to the ConceptDraw DIAGRAM diagramming and vector drawing software extended with Histograms solution from the Graphs and Charts Area of ConceptDraw Solution Park this process became simple and fast.Histogram
ConceptDraw DIAGRAM diagramming and vector drawing software offers the Histograms solution from the Graphs and Charts area of ConceptDraw Solution Park with powerful tools to help you draw a Histogram of any complexity quick and easy.How To Draw a Histogram?
How to draw a Histogram? It's very fast and easy to draw any Histogram using the tools of ConceptDraw DIAGRAM software extended with Histograms solution from the Graphs and Charts area of ConceptDraw Solution Park.
 Histograms
How to make a Histogram? Making a Histogram is an incredibly easy process when it is done with ConceptDraw DIAGRAM. The Histograms Solution enhances ConceptDraw DIAGRAM functionality with extensive drawing tools, numerous samples, and examples; also a quick-start template and library of ready vector stencils for visualization the data and professional drawing Histograms.
Best Program to Make Diagrams
Make diagrams, charts, workflows, flowcharts, org charts, project charts easily with ConceptDraw software.
Make a Histogram
ConceptDraw DIAGRAM extended with Histograms solution from the Graphs and Charts area of ConceptDraw Solution Park lets you make a Histogram of any complexity in minutes.
 Basic Histograms
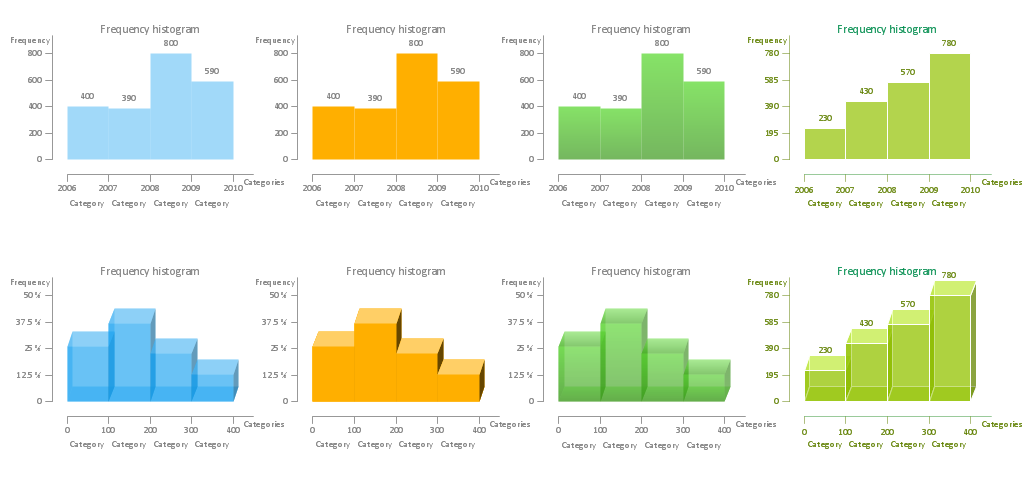
This solution extends the capabilities of ConceptDraw DIAGRAM (or later) with templates, samples and a library of vector stencils for drawing Histograms.
Basic Diagramming
Block diagrams are essentially a very simple format of diagrams. A variety of commonly used shapes and connecting lines, rules of construction and actions pertaining to them, make Block diagram a versatile and flexible tool for many forms of industry. Another advantage is the ease with which Block diagrams can be constructed, especially if you use professional diagramming software. ConceptDraw DIAGRAM software is an example of purpose built application designed with the form of process modeling in mind. It includes Block Diagrams solution from Diagrams area of ConceptDraw Solution Park for easy drawing professional-looking simple diagram - Block diagram, and a lot of other useful solutions for designing variety of other types of diagrams, schematics and flowcharts (Line graphs, Bar charts, Organizational charts, Histograms, Pie charts, Process flowcharts, Fault tree analysis diagrams, Scatter plots, Venn diagrams, Bubble diagrams, etc.). The RapidDraw functionality of ConceptDraw DIAGRAM lets create new objects and their connectors in just single-click.
The Best Drawing Program for Mac
ConceptDraw DIAGRAM is the professional business graphic software for drawing diagrams and charts with great visual appeal on Mac OS X.Pie Chart Software
A pie chart is a circular diagram showing a set of data divided into proportional slices. There are several variations of this chart such as donut chart, exploded pie chart, multi-level pie charts. Although it is not very informative when a ring chart or circle chart has many sections, so choosing a low number of data points is quite important for a useful pie chart. ConceptDraw DIAGRAM software with Pie Charts solution helps to create pie and donut charts for effective displaying proportions in statistics, business and mass media for composition comparison, i.e. for visualization of part percentage inside one total.Basic Diagramming
Try ConceptDraw program, the perfect drawing tool for creating all kinds of great-looking drawings, charts, graphs, and illustrations.
Best Diagramming Software for macOS
ConceptDraw DIAGRAM creates drawings, flowcharts, block diagrams, bar charts, histograms, pie charts, divided bar diagrams, line graphs, area charts, scatter plots, circular arrows diagrams, Venn diagrams, bubble diagrams with great visual appeal on Mac OS X.
- Histograms Bar Graphs Software For Windows
- How to Draw a Histogram in ConceptDraw PRO
- Histograms | Basic Diagramming | The Best Drawing Program for ...
- How to Draw a Histogram in ConceptDraw PRO | Seven Basic Tools ...
- Histogram Chart | How Do You Make a Histogram ? | Make a ...
- Histogram Microsoft Template Example Free Download
- Histograms | Histogram Chart | How To Make a Histogram ...
- Pc Program For Drawing Of Graphs And Histograms
- Histogram Chart | Histogram | Make a Histogram | Histogram Chart
- How to Draw a Histogram in ConceptDraw PRO | How To Draw a ...
- Histograms | Histogram Chart | How to Draw a Histogram in ...
- Flowchart For Program For Generating Histogram
- How to Draw a Histogram in ConceptDraw PRO | How Do You Make ...
- Histograms | Histogram Chart | Basic Histograms | Histograms
- Seven Basic Tools of Quality - Histogram | Histograms | Making a ...
- Histogram Chart | Make a Histogram | Histograms | What Is A ...
- Histogram Chart | Histogram | Making a Histogram | Bar Graph Vs ...
- Histogram Example For Software Development
- Histograms | Basic Histograms | Histogram | Histograms Solution


