HelpDesk
How to Draw a Histogram
A histogram is a diagram used to visualize data through bars of variable heights. Making histogram can be helpful if you need to show data covering various periods (hours, days, weeks, etc). When the vertical column of the histogram refers to the frequency it shows how many times an event happens. It is a Frequency Histogram. A bar chart diagram is similar to a histogram, but in contrast to a bar chart, a histogram represents the number how many times there have been certain data values. You can use a histogram to depict continual data flow such as temperature, time, etc. You can effortlessly draw histograms using the Histograms solution for ConceptDraw DIAGRAM. Making a histogram can be very useful to represent various statistical data.
 Cross-Functional Flowcharts
Cross-functional flowcharts are powerful and useful tool for visualizing and analyzing complex business processes which requires involvement of multiple people, teams or even departments. They let clearly represent a sequence of the process steps, the order of operations, relationships between processes and responsible functional units (such as departments or positions).
Vertical Cross Functional Flowchart
ConceptDraw DIAGRAM is a powerful tool that helps you create professional looking cross-functional flowcharts with the well-designed objects. ConceptDraw DIAGRAM - Drawing Software for Vertical Cross Functional Flowchart. ConceptDraw allows you to focus on work, not the drawing process. ConceptDraw Arrows10 Technology allows to draw connectors with smart behavior that gives flexibility to you during work process.Chart Examples
Easy charting software comes with beautiful chart templates and examples. This makes it easy to create professional charts without prior experience.
 Frequency Distribution Dashboard
Frequency distribution dashboard solution extends ConceptDraw DIAGRAM software with samples, templates and vector stencils libraries with histograms and area charts for drawing the visual dashboards showing frequency distribution of data.
 Flowcharts
The Flowcharts solution for ConceptDraw DIAGRAM is a comprehensive set of examples and samples in several varied color themes for professionals that need to represent graphically a process. Solution value is added by the basic flow chart template and shapes' libraries of flowchart notation. ConceptDraw DIAGRAM flow chart creator lets one depict the processes of any complexity and length, as well as design the Flowchart either vertically or horizontally.
 Audit Flowcharts
Audit flowcharts solution extends ConceptDraw DIAGRAM software with templates, samples and library of vector stencils for drawing the audit and fiscal flow charts.
 Sales Flowcharts
The Sales Flowcharts solution lets you create and display sales process maps, sales process workflows, sales steps, the sales process, and anything else involving sales process management.
 Accounting Flowcharts
Accounting Flowcharts solution extends ConceptDraw DIAGRAM software with templates, samples and library of vector stencils for drawing the accounting flow charts.
HelpDesk
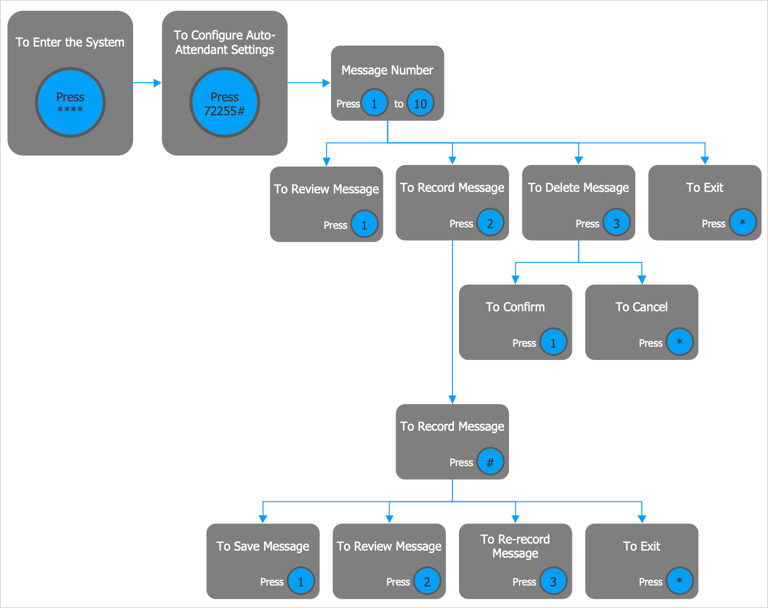
How to Create an Interactive Voice Response (IVR) Diagram
Interactive Voice Response (IVR) Diagram is used to create and conduct the Interactive Voice Response systems for call-centers and voice mail services. IVR diagrams intended to visualize the logical and physical structure of Interactive voice response systems. ConceptDraw solution for Interactive Voice Response (IVR) Diagram allows you to create and communicate the Interactive Voice Response diagram of any complexity. Interactive Voice Response (IVR) System is a telecommunication technology that enables a computer to automatically process voice and touch phone signals. IVR systems allows users to interact through a computer with various service systems, available by telephone. The objective of IVR system is to reduce customer service costs by delivering self service to customers and guiding them to the information that they look for.Examples of Flowcharts, Org Charts and More
ConceptDraw DIAGRAM covers a broad spectrum of business graphics categories and offers at ConceptDraw STORE enormous online collection of pictorial examples and samples for different thematics and application areas. It is a plentiful source of inspiration and wonderful examples of professionally designed diagrams, flowcharts, UML diagrams, organizational charts, databases, ERDs, network diagrams, business charts, different thematic charts, schematics, infographics and plans developed specially for knowledge workers, engineers, managers, businessmen, marketing specialists, analytics, scientists, students, professors, journalists and also for a large number of other people that every day use various diagrams and drawings in their work and life activity. Each of these examples is a real art, all they are well thought-out and designed without efforts with help of powerful tools of ConceptDraw DIAGRAM software. ConceptDraw examples display all variety of tasks, possibilities and results that ConceptDraw Product Line lets achieve fast and easy. ConceptDraw is one of the best Visio alternatives for Mac. It open all Visio formats like.vsdx,.vss,.vdx files and allows you to export files to Visio formats.
 Accounting Flowcharts
Accounting Flowcharts solution extends ConceptDraw DIAGRAM software with templates, samples and library of vector stencils for drawing the accounting flow charts.
 HR Flowcharts
Human resource management diagrams show recruitment models, the hiring process and human resource development of human resources.
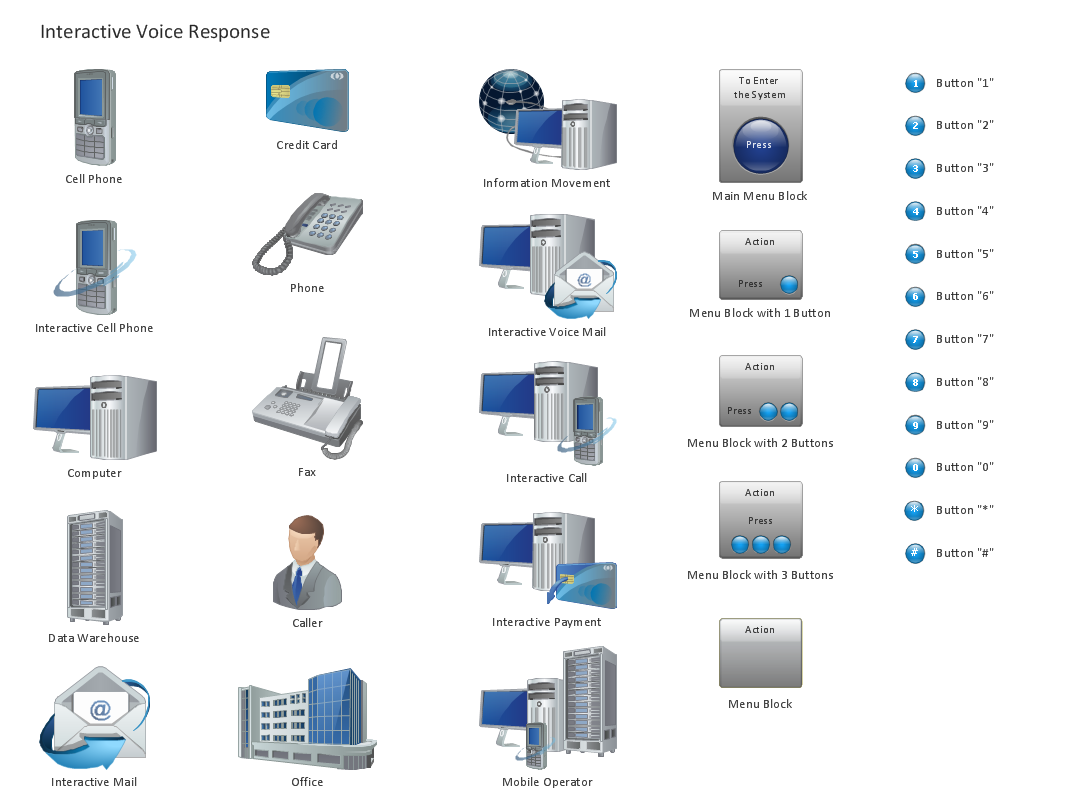
Design Element: IVR for Network Diagrams
ConceptDraw DIAGRAM is perfect for software designers and software developers who need to draw IVR Network Diagrams.
- Frequency Distribution Flow Chart
- How To Draw Flowchart Of Frequency Meter
- Frequency Distribution Dashboard | Swim Lane Flowchart Symbols ...
- Frequency Distribution Dashboard | Flow chart Example ...
- Flow chart Example. Warehouse Flowchart | Frequency Distribution ...
- Frequency Distribution Dashboard | Flow chart Example ...
- Frequency Distribution Dashboard | Cisco Network Diagrams | Flow ...
- Frequency Distribution Dashboard | Cisco Network Diagrams | Flow ...
- Frequency Distribution Dashboard | Cross-Functional Flowcharts ...
- Basic Flowchart Symbols and Meaning | Process Flowchart | Cross ...
- Employee distribution - HR dashboard | How to Create a HR ...
- Flowchart Marketing Process. Flowchart Examples | Flow chart ...
- Frequency Distribution Dashboard | Product Overview | Cisco ...
- Histograms | Examples of Flowcharts , Org Charts and More | Simple ...
- Distributer Management System Erd Diagrams
- Frequency Distribution Dashboard | Cisco Network Diagrams | Star ...
- Basic Flowchart Symbols and Meaning | ERD Symbols and ...
- Frequency distribution charts - Vector stencils library | Histogram ...
- Frequency Distribution Dashboard | Design elements - Frequency ...
- Cross-Functional Flowchart | Mechanical Engineering | Flowchart ...


