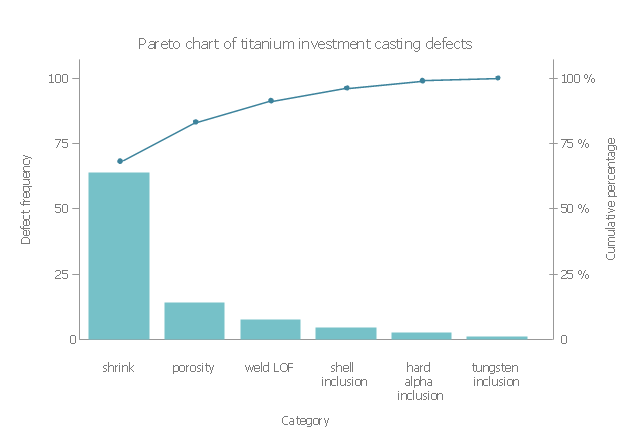
This example was redesigned from the Wikimedia Commons file: Pareto chart of titanium investment casting defects.svg.
[commons.wikimedia.org/ wiki/ File:Pareto_ chart_ of_ titanium_ investment_ casting_ defects.svg]
This file is licensed under the Creative Commons Attribution-Share Alike 3.0 Unported license. [creativecommons.org/ licenses/ by-sa/ 3.0/ deed.en]
"A Pareto chart, named after Vilfredo Pareto, is a type of chart that contains both bars and a line graph, where individual values are represented in descending order by bars, and the cumulative total is represented by the line.
The left vertical axis is the frequency of occurrence, but it can alternatively represent cost or another important unit of measure. The right vertical axis is the cumulative percentage of the total number of occurrences, total cost, or total of the particular unit of measure. Because the reasons are in decreasing order, the cumulative function is a concave function. ...
The Pareto chart is one of the seven basic tools of quality control." [Pareto chart. Wikipedia]
The Pareto chart example "Titanium investment casting defects" was created using the ConceptDraw PRO software extended with the Seven Basic Tools of Quality solution from the Quality area of ConceptDraw Solution Park.
Examples of Flowcharts, Org Charts and More
ConceptDraw DIAGRAM covers a broad spectrum of business graphics categories and offers at ConceptDraw STORE enormous online collection of pictorial examples and samples for different thematics and application areas. It is a plentiful source of inspiration and wonderful examples of professionally designed diagrams, flowcharts, UML diagrams, organizational charts, databases, ERDs, network diagrams, business charts, different thematic charts, schematics, infographics and plans developed specially for knowledge workers, engineers, managers, businessmen, marketing specialists, analytics, scientists, students, professors, journalists and also for a large number of other people that every day use various diagrams and drawings in their work and life activity. Each of these examples is a real art, all they are well thought-out and designed without efforts with help of powerful tools of ConceptDraw DIAGRAM software. ConceptDraw examples display all variety of tasks, possibilities and results that ConceptDraw Product Line lets achieve fast and easy. ConceptDraw is one of the best Visio alternatives for Mac. It open all Visio formats like.vsdx,.vss,.vdx files and allows you to export files to Visio formats.
- How to Draw a Pareto Chart Using ConceptDraw PRO | Pareto ...
- Quality Control Chart Software — ISO Flowcharting | Seven Basic ...
- Function Of Total Quality Management Graph
- Block Diagram As Tool Of Quality
- Block Diagram Creator | Process Flowchart | ConceptDraw Solution ...
- Quality Control Chart Software — ISO Flowcharting | Process ...
- Block Diagrams | ConceptDraw Solution Park | HVAC Plans | Hvac ...
- Cause Effect Diagrams Tqm
- Swot Analysis Of An Individual
- Active Directory Diagram | How To Create a MS Visio Data-driven ...
- Schedule pie chart - Daily action plan | Pareto Chart | Pyramid ...
- Block diagram - Gap model of service quality | Block Diagram ...
- Total Quality Management TQM Diagrams | Process Flowchart ...
- Quality Block Diagram Template
- Event-driven Process Chain (EPC) Diagrams | Modelling Concepts ...
- Design elements - Soccer (Football) positions | How to Make Soccer ...
- Schedule pie chart - Daily action plan | Gant Chart in Project ...
- How to Make Soccer Position Diagram Using ConceptDraw PRO ...
- Flochart Of Function Of Quality And Quality Control
- Scientific Management Block Diagram

