The vector stencils library "Marketing maps" contains 44 state map contours with capitals and major cities: the Group of Twenty (G20) state maps, EU state maps and World map.
Use it to visualize geospatial information in your marketing infograms.
"The Group of Twenty (also known as the G-20 or G20) is a forum for the governments and central bank governors from 20 major economies. The members, shown highlighted on the map at right, include 19 individual countries—Argentina, Australia, Brazil, Canada, China, France, Germany, India, Indonesia, Italy, Japan, Republic of Korea, Mexico, Russian Federation, Saudi Arabia, South Africa, Turkey, United Kingdom, United States—and the European Union (EU). The EU is represented by the European Commission and by the ECB." [G-20 major economies. Wikipedia]
The G-20 state map contours example "Design elements - Marketing maps (G-20)" was created using the ConceptDraw PRO diagramming and vector drawing software extended with the Marketing Infographics solition from the area "Business Infographics" in ConceptDraw Solution Park.
Education Information
The Education Information is multifariuos and can be often represented in various forms. Еру the most successful ways of presentation the information and data are various illustrations, diagrams and colorful education infographics which you can easily make in ConceptDraw PRO software extended with Education Infographics Solution from the Business Infographics Area.
 Education Package
Education Package is a comprehensive set of multifarious graphical solutions from ConceptDraw Solution Park, collected together in help to ConceptDraw PRO users working in a field of science, education and training, which is aimed at improving the quality of education and helping to design with ease variety of interesting and colorful educational materials, diagrams, charts and maps. Use it to present the information and knowledge in an interesting, clear, structured and simple form to achieve a success in education and pedagogy, to maintain the interest of students and pupils throughout the whole learning process, at the lectures, lessons and even during independent work with additional materials, to contribute to better perception of scientific information by listeners during the conferences and reports.
Marketing Infographics
Marketing Infographics is a very popular tool that allows to represent the complex data, knowledge, and other marketing information in a simple, visual and attractive graphical form. But how to draw Marketing Infographics simply and quickly? ConceptDraw PRO diagramming and vector drawing software extended with unique Marketing Infographics Solution from the Business Infographics Area will help you design marketing infographics without efforts. This toolset included in ConceptDraw Office for small business project management, creating presentations using marketing infographics is critical part project management reporting software.- Png Indonesia Map Infographic Element
- European Capitals Map Hd
- G20 Map
- Geo Map - Asia - India | Design elements - Marketing maps (G-20 ...
- Geo Mapping Software Examples - World Map Outline | Geo Map ...
- Design elements - Education maps (World map ) | Design elements ...
- Business World Presentation | Social Media Marketing Infographic ...
- World Maps
- Africa map with countries , main cities and capitals - Template | Geo ...
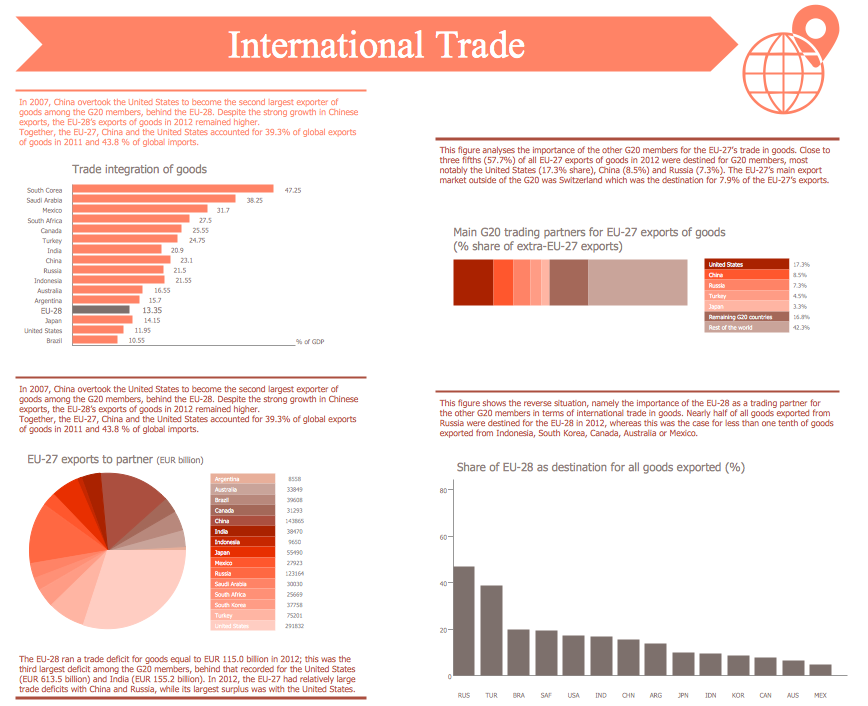
- EU 28: Candidate countries map | International trade statistics - EU ...
- Internet marketing - Concept map
- Geo Map - World | Map Software | Superb Examples of Infographic ...
- Africa map with countries , main cities and capitals - Template ...
- Canada Usa Russia Map
- Design elements - Marketing maps (G-20) | Geo Map - Asia - South ...
- Marketing Mind Maps | Mind Maps for Business - SWOT Analysis ...
- World Map
- Geo Map - Asia - India | Management maps - Vector stencils library ...
- How to Support Your Mind Map with Visual Elements | Subway ...
- Geo Map - South America Continent | Design elements - Marketing ...
-state-maps-design-elements---marketing-maps-(g-20).png--diagram-flowchart-example.png)

