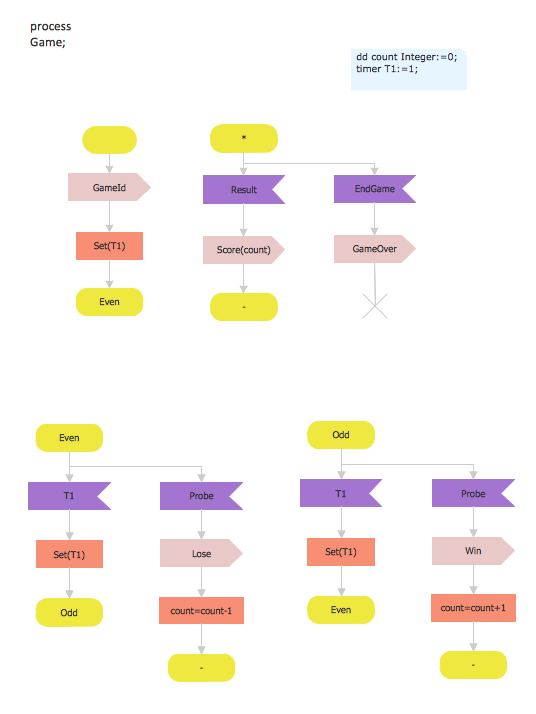
SDL Diagram
Specification and Description Language (SDL) is used for creating the object-oriented diagrams, visualizing the processes of the state machines for the systems of communication, telecommunication, automotive, aviation and medical industries. SDL is a specification language for creating specifications, descriptions of the behavior, data, and inheritance for real-time systems. This sample shows the SDL Diagram of the process game.Data Flow Diagrams
The information system manages the flow of data introduced into the system. To graphically represent and document the flow of data through some information system is used a Data Flow Diagram (DFD). DFD is a way to visualize the flow of data or data processing, to clearly demonstrate what type of data or information is transferred, where they come from and where are sent. It lets to create an overview of the system, to depict the major steps, and effectively model the processes. DFDs are helpful for analyzing and modifying the business systems. Traditionally are used two notations for DFDs creation - Yourdon-Coad and Gane-Sarson. ConceptDraw DIAGRAM software offers a special Data Flow Diagrams solution from Software Development area, which enables to quickly and simply create professional Data Flow Diagrams including the data storage, data flows, external entities, functional transforms, control transforms and signals. Use the offered templates, samples and extensive range of libraries to design your own Data Flow Diagrams in minutes.Example of DFD for Online Store (Data Flow Diagram)
Data Flow Diagram (DFD) is a methodology of graphical structural analysis and information systems design, which describes the sources external in respect to the system, recipients of data, logical functions, data flows and data stores that are accessed. DFDs allow to identify relationships between various system's components and are effectively used in business analysis and information systems analysis. They are useful for system’s high-level details modeling, to show how the input data are transformed to output results via the sequence of functional transformations. For description of DFD diagrams are uses two notations — Yourdon and Gane-Sarson, which differ in syntax. Online Store DFD example illustrates the Data Flow Diagram for online store, the interactions between Customers, Visitors, Sellers, depicts User databases and the flows of Website Information. ConceptDraw DIAGRAM enhanced with Data Flow Diagrams solution lets you to draw clear and simple example of DFD for Online Store using special libraries of predesigned DFD symbols.
Data Flow Diagram
Data Flow Diagram (DFD) is the part of the Structured Systems Analysis and Design Methodology (SSADM), which is intended for information systems projection and analysis. Data Flow Diagrams allow graphically represent the data flows in information system and analyze the data processing during the structural projection. This type of diagrams lets visually show a work of information system and results of this work, it is often used in connection with human processes and can be displayed as Workflow diagram. Data Flow Diagram visualizes processes and functions, external entities, data depositories, and data flows connecting these elements and indicating direction and data character. Each of these elements used for DFD has its own graphical notation. There are two notations to draw DFDs - Yourdon & Coad and Gane & Sarson. ConceptDraw DIAGRAM extended with Data Flow Diagrams (DFD) solution from Software Developmant area is ideal for designing professional looking DFDs, which can be then easily exported in various formats.Business process Flow Chart — Event-Driven Process chain (EPC) diagrams
Event-Driven Process chain Diagrams for improvement throughout an organisation. Best software for Process Flow Diagram. The Event-driven Process Chain (EPC) Diagrams allows managers to plan processes and resources.Software and Database Design with ConceptDraw DIAGRAM
Unified Modeling Language (abbr. UML) is a modeling language used by software developers and software engineers for developing diagrams, expressive modeling, visualization, construction, specification, and documentation an information about software-intensive systems. There are used many types of UML diagrams, joined in main groups, each of them has its own functional abilities and applications: Behaviour diagrams illustrate the functionality of software systems, Structuring diagrams depict a structure of objects at the systems, Interaction diagrams show the flow of control and data among the things in a modeling system. UML has a lot of practical applications in varied areas, among them software development, hardware design, banking and financial services, telecommunication, science, research, enterprise information system, distributed Web-based services, user interfaces for web applications, medical electronics, patient healthcare systems, etc. ConceptDraw DIAGRAM extended with Rapid UML solution is a perfect tool for UML diagramming.Flow Chart Symbols
The Flowcharts are incredibly useful and popular tool used in science, business, software development, analytics, engineering, marketing, manufacturing, administration, architecture, government, politics, and many other fields thanks to a variety of existing types of flowcharts. A Flowchart is a visual graphical representation of the process, algorithm, or the set of steps taken for problem's solution. Widely used for designing, visualizing and documenting simple and complex processes and programs, they effectively help to understand the process and to find easier the flaws if they are. Each flowchart type supposes the use of its own set of notations for drawing corresponding diagram, which includes the symbols of process, decision, data, document, data base, termination, initiation processes, processing loops, conditions, etc. It is easily design a Flowchart using the special professional flowchart maker - ConceptDraw DIAGRAM diagram software with numerous predesigned flow chart symbols grouped in libraries of Flowcharts solution from ConceptDraw Solution Park.Design Data Flow. DFD Library
Data flow diagram or DFD is a type of diagrams used for graphical representation the "flow" of data through an information system, for effective modeling its process aspects and for visualization the data processing. They are one of the best tools for clearly making an overview of the system that will be developed, for depiction in details what kinds of information will be inputted to the system and outputted from it, where they will be stored, and other details. ConceptDraw DIAGRAM software with Data Flow Diagrams solution from Software Development area of ConceptDraw Solution Park is powerful in a field of designing the DFDs. Three libraries containing 49 vector DFD shapes and symbols are offered by Data Flow Diagrams (DFD) solution. Use them to design data flow diagrams, information flow diagrams, data flowcharts, data process diagrams, structured analysis diagrams, to create the data-oriented models or process-oriented models, and so on. Pay also attention for the included collection of DFD samples, examples and built-in templates at ConceptDraw STORE.
Logistics Flow Charts
Logistics Flow Charts solution extends ConceptDraw DIAGRAM functionality with opportunities of powerful logistics management software. It provides large collection of predesigned vector logistic symbols, pictograms, objects and clipart to help you design with pleasure Logistics flow chart, Logistics process flow diagram, Inventory flow chart, Warehouse flowchart, Warehouse management flow chart, Inventory control flowchart, or any other Logistics diagram. Use this solution for logistics planning, to reflect logistics activities and processes of an enterprise or firm, to depict the company's supply chains, to demonstrate the ways of enhancing the economic stability on the market, to realize logistics reforms and effective products' promotion.
Business Process Flow Diagram
Business Process Flow Diagram is a graphical presentation of business processes and process flows. It is one of the main tool of business analysis and business process re-engineering that lets identify and easy understand process flows within organization. ConceptDraw DIAGRAM extended with Business Process Workflow Diagrams solution from the Business Processes area of ConceptDraw Solution Park is a powerful software which lets easy design Business Process Flow Diagram of any complexity.- Top 5 Android Flow Chart Apps | Data Flow Diagram For Game ...
- Data Flow Diagram For A Multiplayer Shooting Game
- Data Flow Diagram For Video Games
- Shooting Game Dfd
- Football | Winter Sports | Sport Field Plans | Dfd For Game
- IDEF1X Standard | Context Diagram For Games
- Context Diagram For Android Game
- Example of DFD for Online Store ( Data Flow Diagram ) DFD ...
- Chen's ERD of MMORPG | Top 5 Android Flow Chart Apps | Er ...
- Data Flow Diagram Game Development