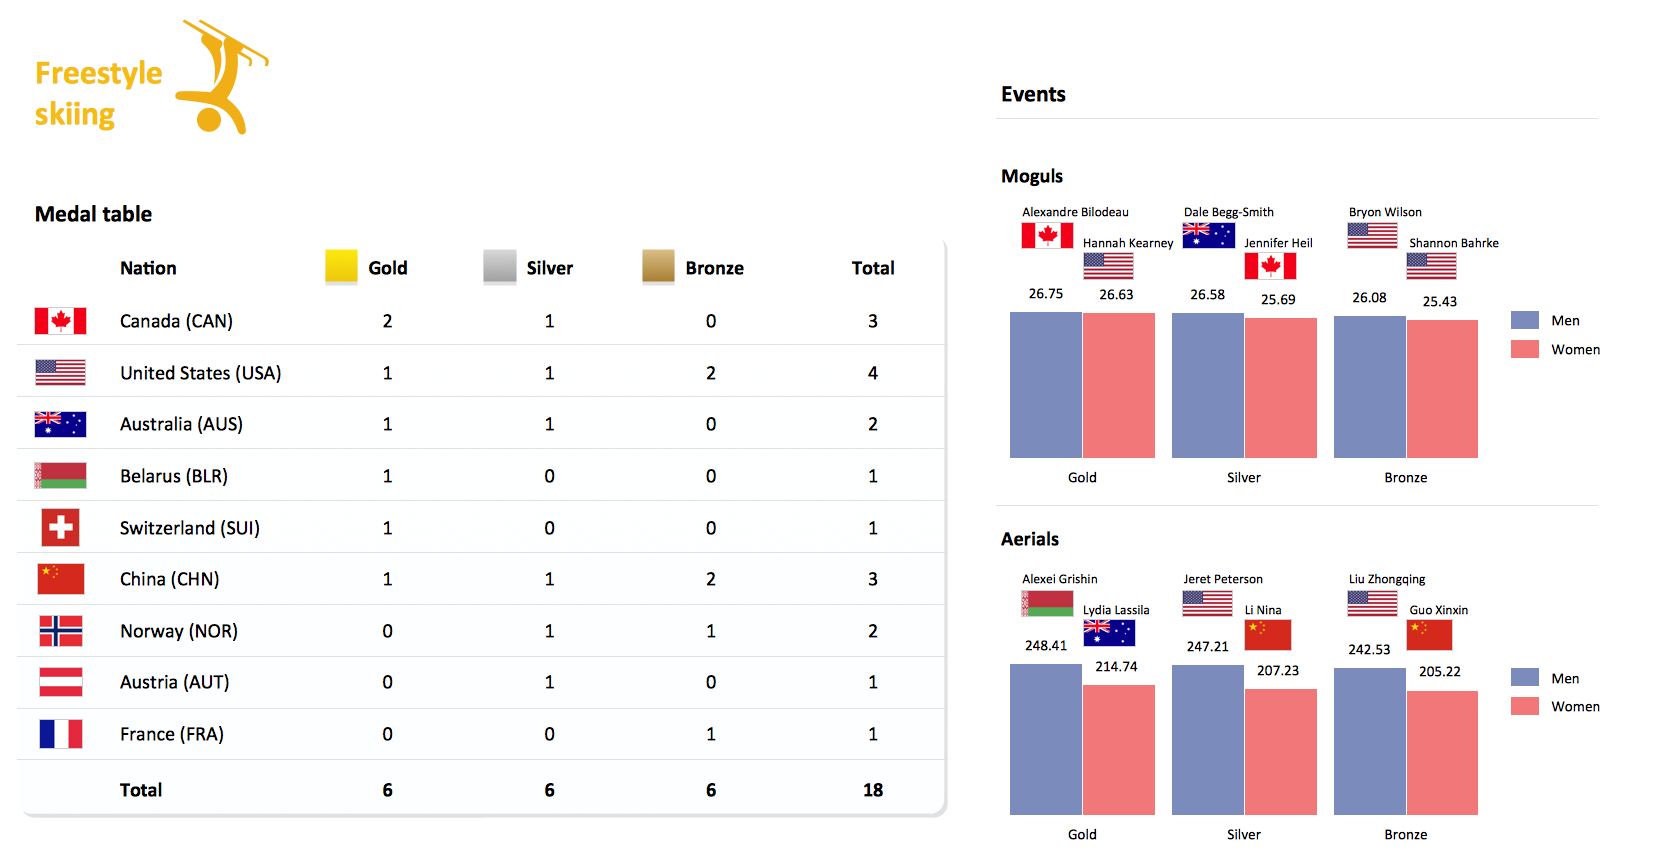
Winter Sports. Olympic Games Illustrations. Medal Summary
Do you like infographics and data visualization? Creating infographics is super-easy with ConceptDraw.Sport pictograms. Olympic Games
The Winter Sports solution from Sport Area of ConceptDraw Solution Park contains winter sports pictograms you may use illustrating any kind of material about Olympic Games or any other sport competitions.Bar Diagrams for Problem Solving. Create event management bar charts with Bar Graphs Solution
Create bar charts for event management problem solving and visual data comparison using the ConceptDraw DIAGRAM diagramming and vector drawing software extended with the Bar Graphs Solution from the Graphs and Charts area of ConceptDraw Solition Park.Basketball Court Dimensions
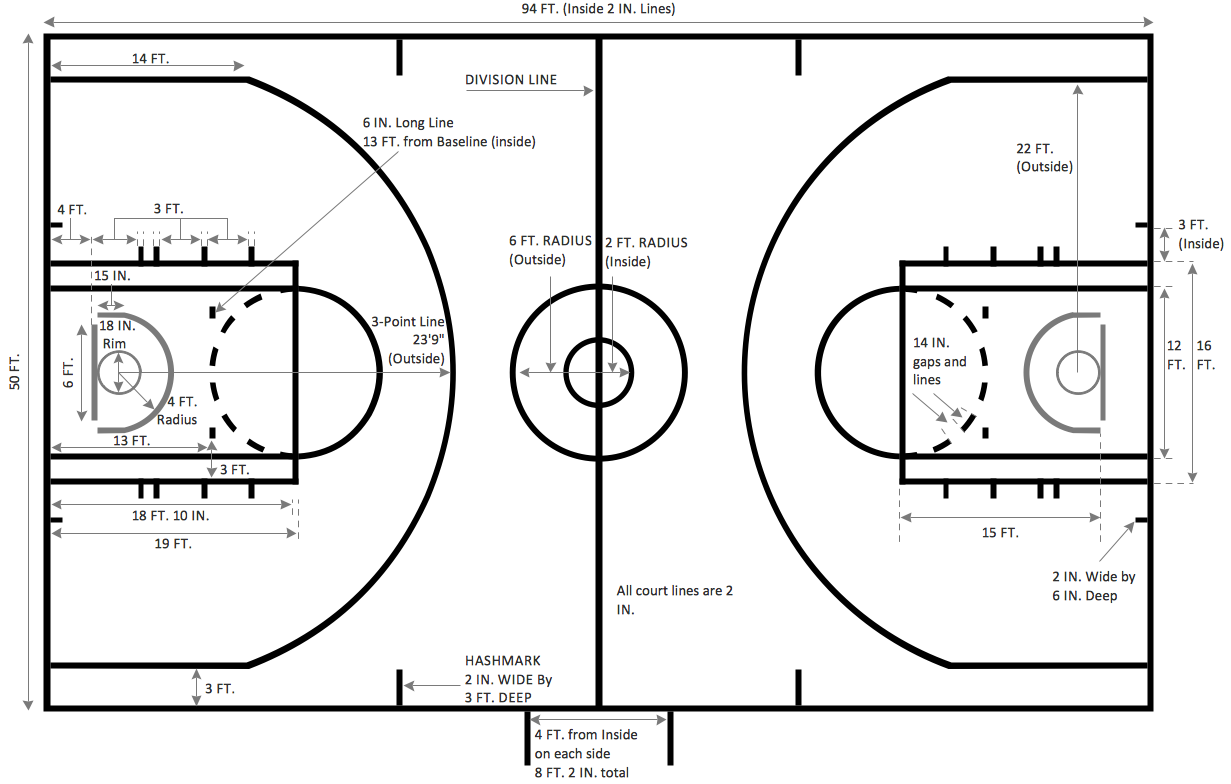
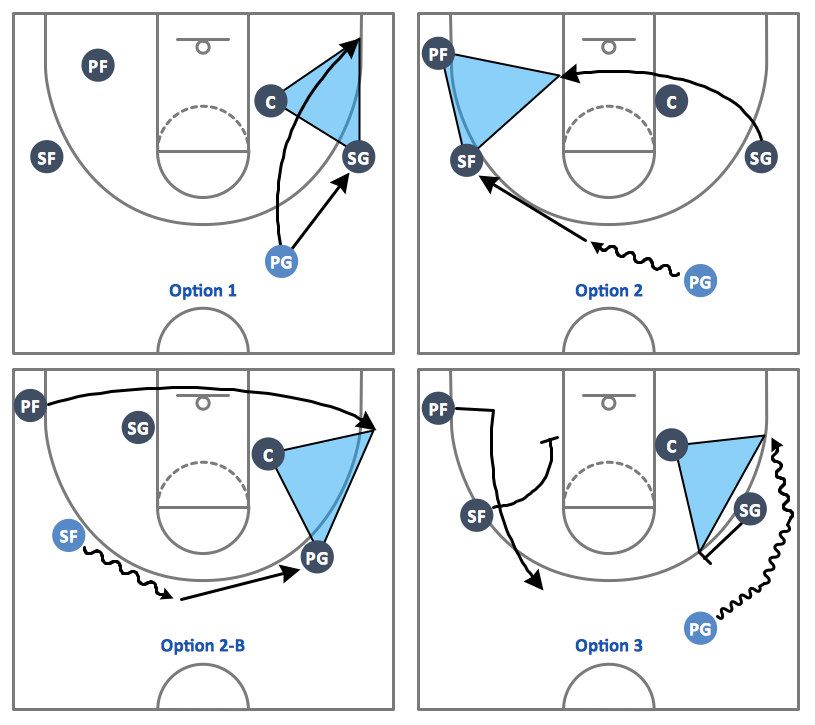
The basketball is a team game with a ball on a specially organized court, which is constructed according to the setted rules and dimensions. The game's standards specify the existence of defined list of equipment on any basketball court, such as backboards, poles, baskets, basketballs, timer, scoreboard, horns, as well as some other additional technical devices. The basketball game's goal is to throw a ball into one of the baskets, that is mounted to a backboard at a certain height on the edges of the court. When planning the construction of basketball court you need primarily create the detailed plan with all dimensions. The Basketball solution from the Sport area of ConceptDraw Solution Park will help you to make it effectively and quickly. This solution was designed as a tool that assists in producing any basketball-related illustrations you need in a few minutes. Use it to illustrate the best and winning positions when training the basketball team, to make the posters when planning the sport competitions, basketball games, sport conferences, etc.
 Chess
Chess
Chess solution extends ConceptDraw DIAGRAM application with samples, special templates and libraries of 2D and 3D elements of chessboards and chess pieces to help display any events on the chessboard, to illustrate the winning positions and chess combinations, to analyze the famous games played by prominent chess masters, to simulate gambits, to teach the audience to play chess and to demonstrate visually the chess rules, to show the variations of moves and ways of setting the checkmate to opponent in a fewest number of steps. Special template ConceptDraw DIAGRAM allows to play chess on a local network.
Ice Hockey Rink Dimensions
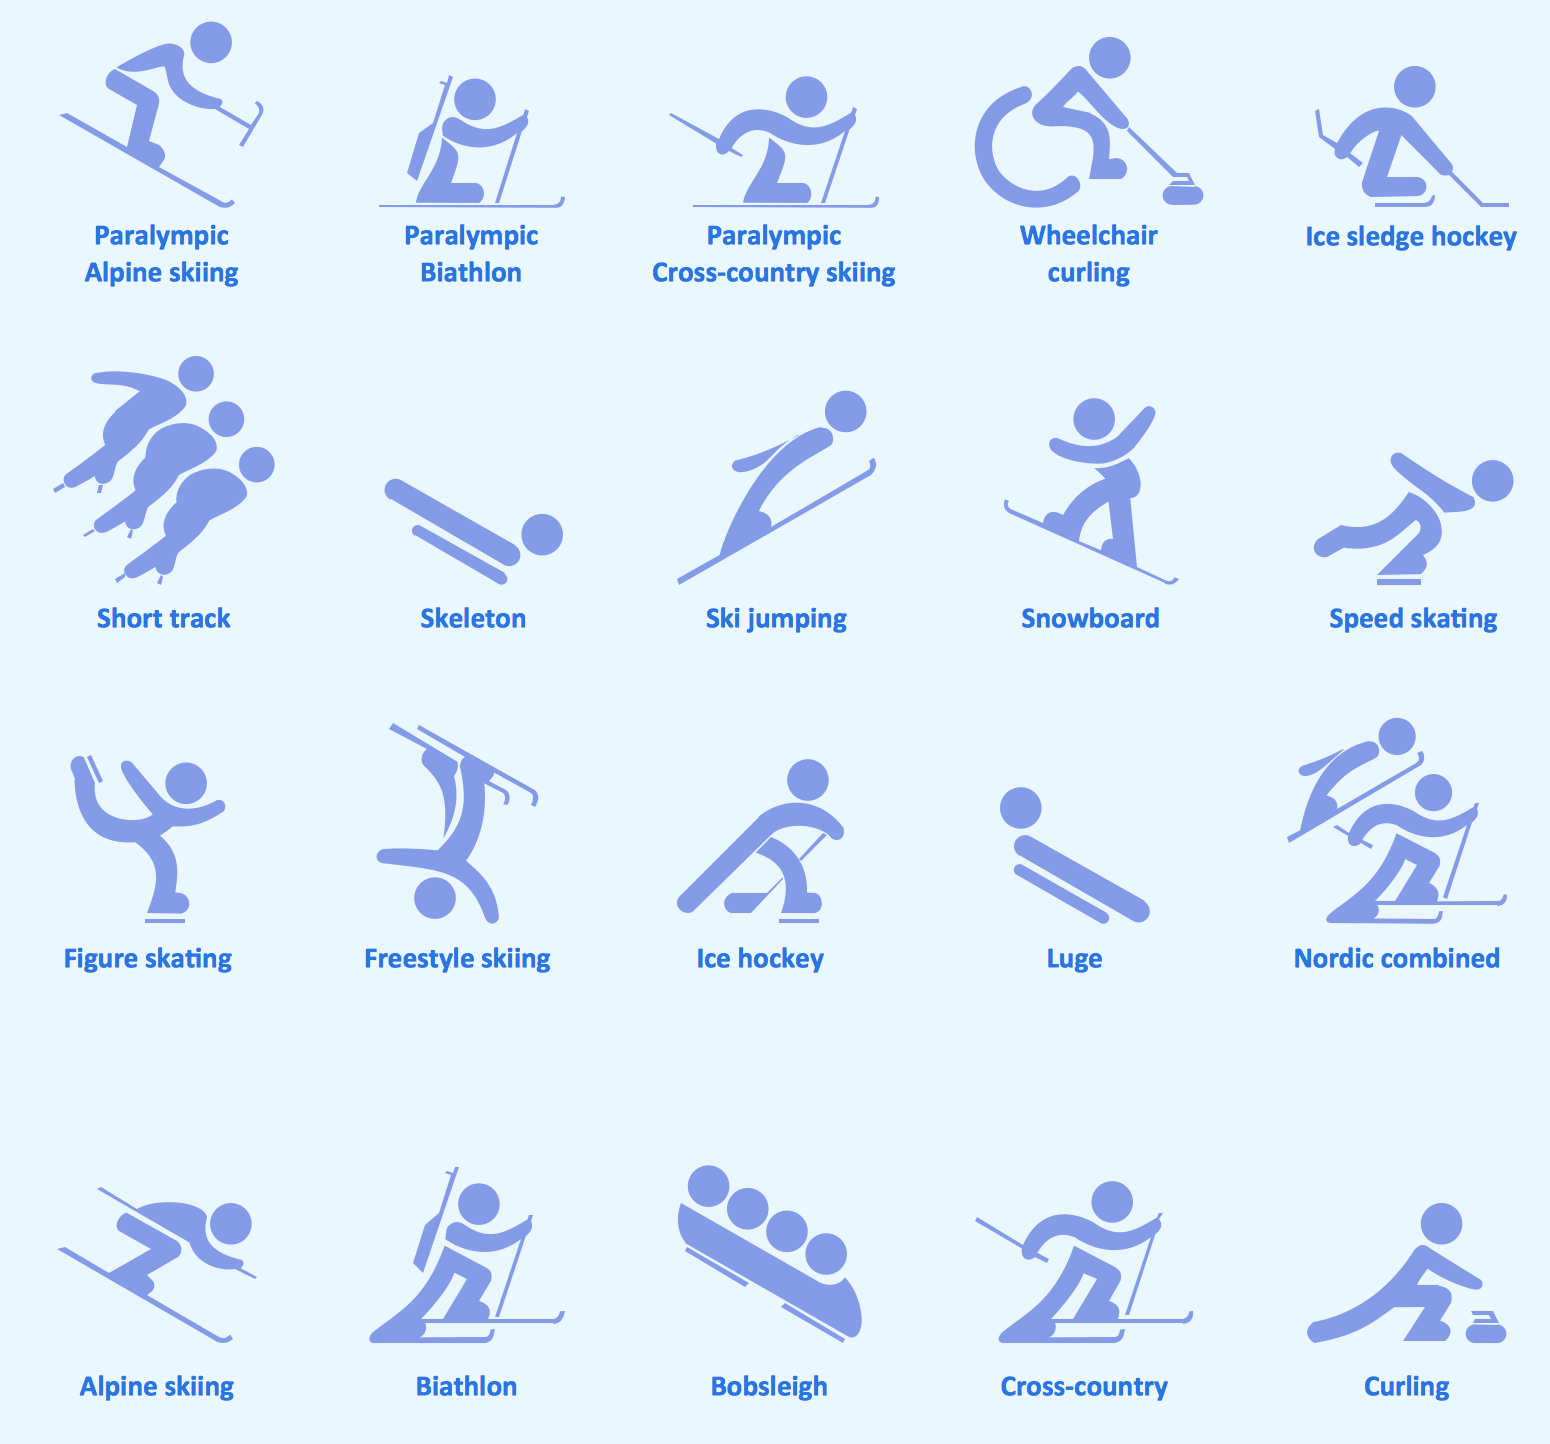
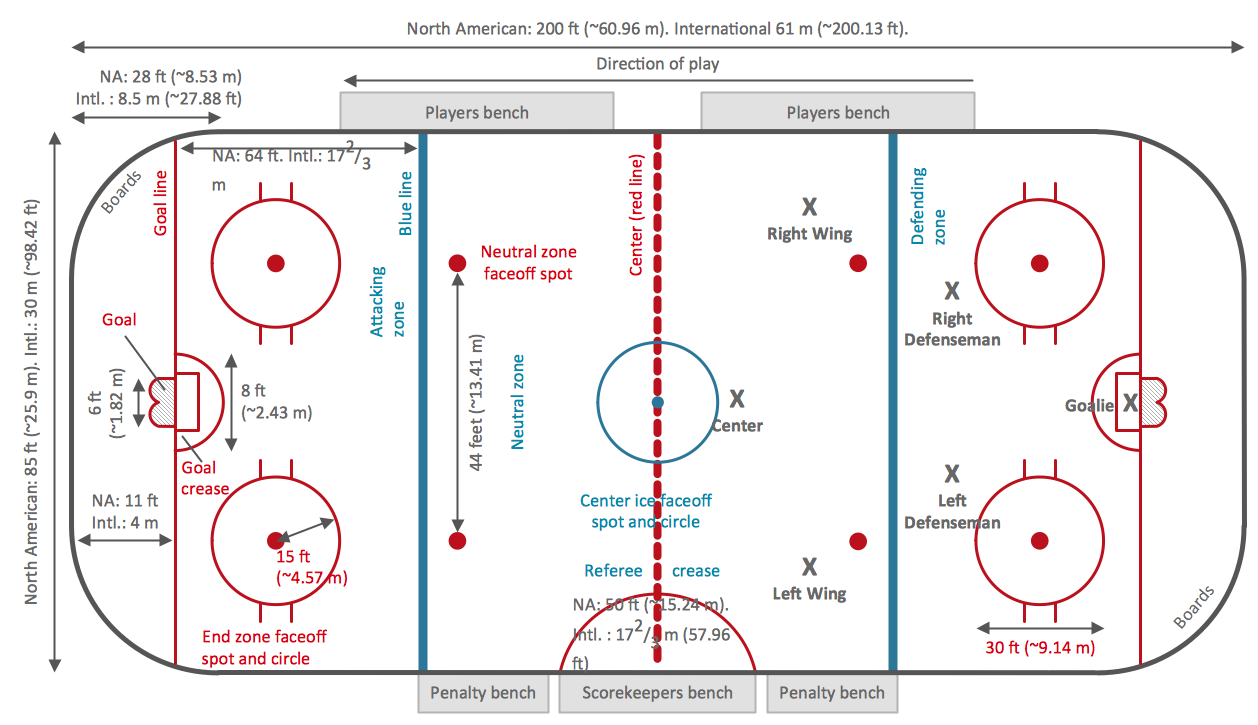
Meeting ice hockey rules one should learn ice hockey rink terms, lines, zones etc. ConceptDraw DIAGRAM is an advanced drawing software that allows you produce ice hockey rink depiction of any complexity, from simple sketch drawing to detailed one as on example below.Winter Sports. Using Winter Sports Design Elements Producing Infographics
The Winter Sports solution from Sport Area of ConceptDraw Solution Park contains winter sports pictogram you may use illustrating any kind of material about Olympic Games or any other sport competitions.Example of DFD for Online Store (Data Flow Diagram)
Data Flow Diagram (DFD) is a methodology of graphical structural analysis and information systems design, which describes the sources external in respect to the system, recipients of data, logical functions, data flows and data stores that are accessed. DFDs allow to identify relationships between various system's components and are effectively used in business analysis and information systems analysis. They are useful for system’s high-level details modeling, to show how the input data are transformed to output results via the sequence of functional transformations. For description of DFD diagrams are uses two notations — Yourdon and Gane-Sarson, which differ in syntax. Online Store DFD example illustrates the Data Flow Diagram for online store, the interactions between Customers, Visitors, Sellers, depicts User databases and the flows of Website Information. ConceptDraw DIAGRAM enhanced with Data Flow Diagrams solution lets you to draw clear and simple example of DFD for Online Store using special libraries of predesigned DFD symbols.
Cause and Effect Analysis
Cause and Effect Analysis - The Seven Management and Planning Tools is a tool for Cause and Effect Analysis that allows users to analyze the root causes for factors that influenced the problem. This diagram is constructed separately for each highly prioritized factor. The Diagram is then used for further formulation of potential actions.
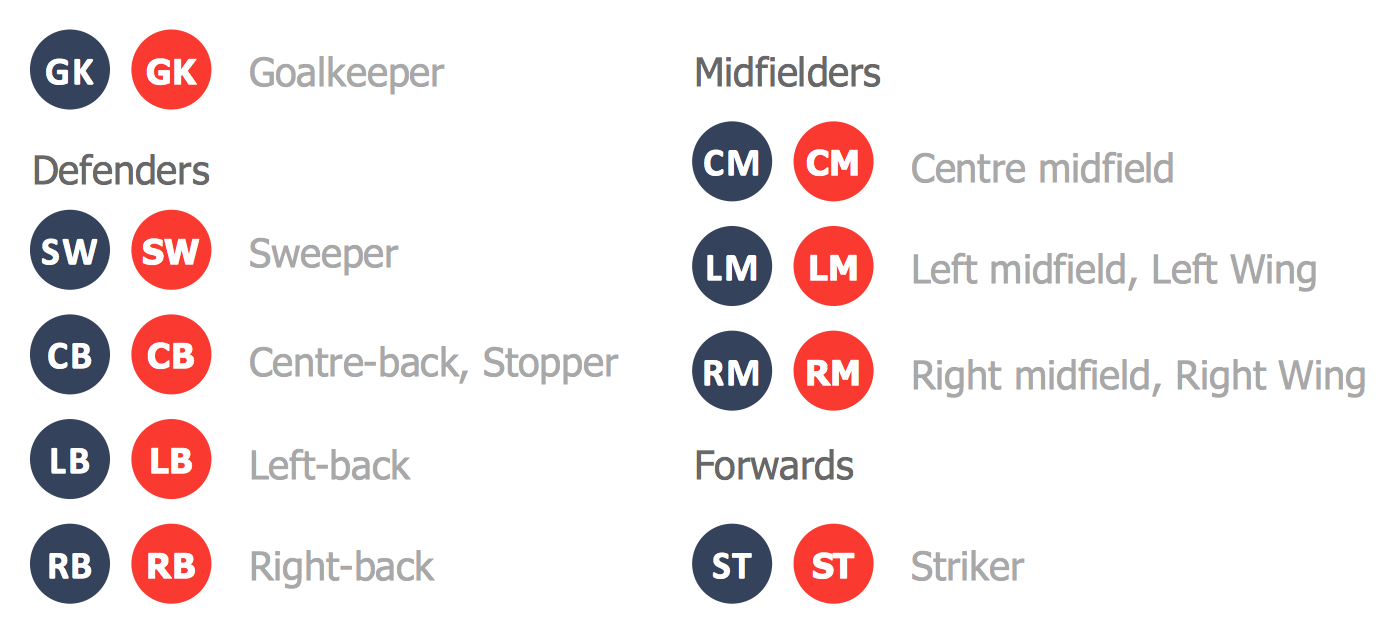
Create Soccer (Football) Positions
Explaining the soccer techniques and rules becomes much more easier and time saving with illustrations. The Soccer solution from the Sport area of ConceptDraw Solution Park provides the libraries, templates and samples that will help you produce the soccer illustrations of any complexity in minutes.Internet Group Management Protocol (IGMP). Computer and Network Examples
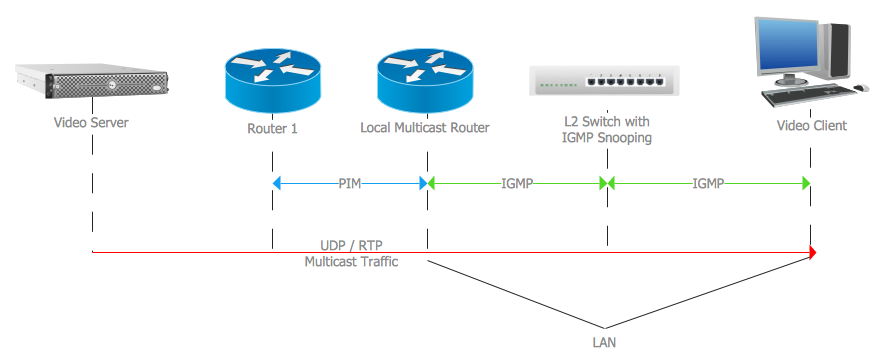
The Internet Group Management Protocol (IGMP) is a communication protocol of the multicast transfer data in the IP networks. IGMP is used by routers and IP hosts for organizing the network devices in groups. This example was created in ConceptDraw DIAGRAM using the Computer and Networks solution from the Computer and Networks area of ConceptDraw Solution Park. It shows the architecture of the network for delivering a multicast service using IGMP.
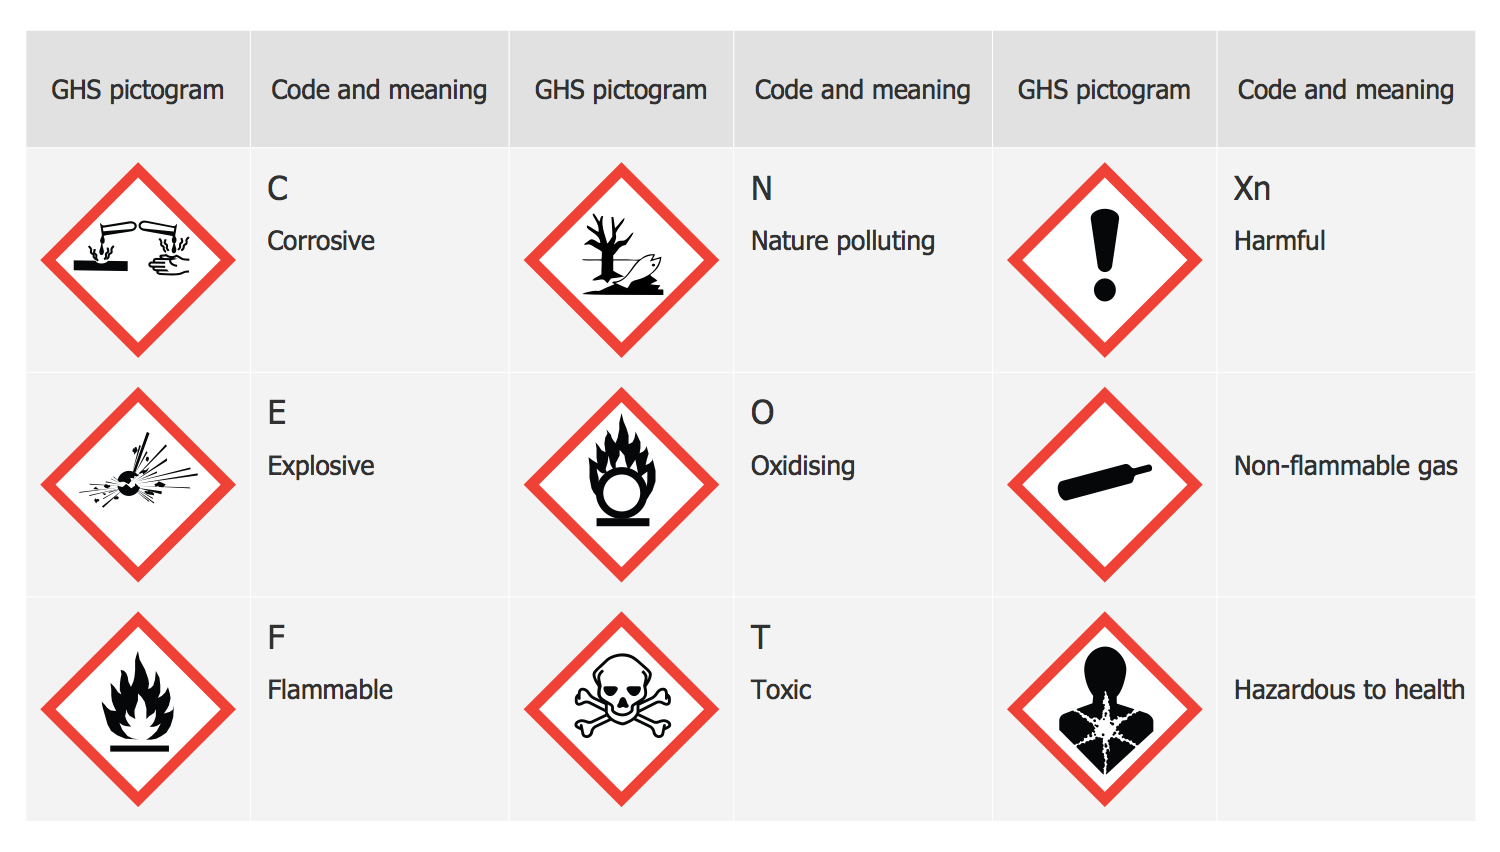
GHS Label Pictograms
Hazard pictograms are those which form a part of the international GHS which is a “Globally Harmonized System of Classification and Labelling of Chemicals. Two sets of pictograms are included within the GHS: one for the labelling of containers and for workplace hazard warnings, and a second for use during the transport of dangerous goods. Either one or the other is chosen, depending on the target audience, but the two are not used together.Basketball Illustrations
It’s very important that your basketball illustrations looked bright, beautiful, interesting and attracted the attention. For this you just need to add the illustrations! The Basketball solution delivers two libraries with predesigned vector clipart objects. Simply drag the needed clipart to your diagram to make it successful.- All Games Ground Measurement Pdf
- All Sport Play Ground Measurement
- GHS Hazard Pictograms | Management pictograms - Vector stencils ...
- Network Topologies | Activity on Node Network Diagramming Tool ...
- Shooting Game Dfd
- Volleyball Ground Magerment
- Winter Sports. Olympic Games Illustrations. Medal Summary | Winter ...
- Download Basketball Court Measurement
- Winter Sports. Olympic Games Infographics. Medal Table | Sport ...
- Winter Sports. Olympic Games Illustrations. Medal Summary | Food ...
- HR Flowchart Symbols | Sport pictograms. Olympic Games | How to ...
- Race Coarse Management System Er Diagram
- Bar Diagrams for Problem Solving. Create event management bar ...
- Winter Sports. Olympic Games Illustrations. Medal Summary | Winter ...
- Social Media Response Management DFD Charts - software tools ...
- Sport Field Plans | Sport pictograms. Olympic Games | Winter Sports ...
- Sport pictograms. Olympic Games | Design Pictorial Infographics ...
- Throw Ball Measurement
- HR Flowchart Symbols | Sport pictograms. Olympic Games | GHS ...
- Infographic Maker | Sign Making Software | Sport pictograms ...
