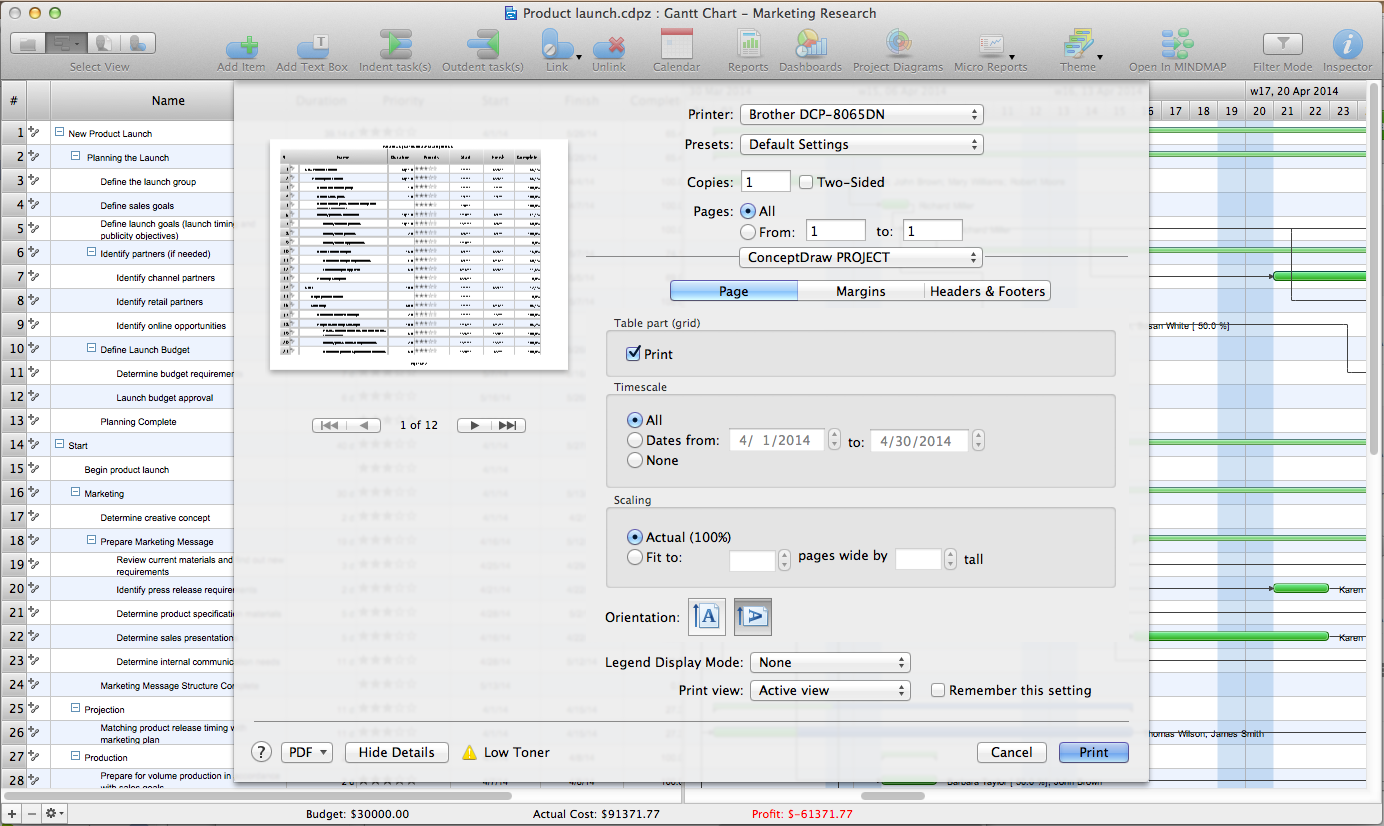
Gant Chart in Project Management
Gantt Chart is a graphical representation of tasks as segments on a time scale. It helps plan and monitor project development or resource allocation. There are list of tasks, project milesones and stages. The horizontal axis is a time scale, expressed either in absolute or relative time. Gantt chart can be used for planning in virtually any industry. There are major project planning tools using gantt chart for creating project plan. For instance, using ConceptDraw PROJECT together with ConceptDraw MINDMAP for planning marketing actions is very effective way. It makes ConceptDraw Office best marketing project management software for gantt chart planning marketing message, scheduling stages when to send massive text messages or when use email marketing services in specific projects. There are simple steps on how to use project management software for marketing, sales actions and product support. This is simple all in one toolbox for managers who need best project management software for small business as for planning and brainstorming as for reporting at project execution stage. Using gantt charts together with mindmap visuals and professional presentations charts make it excellent creative project management software. ConceptDraw PROJECT is portfolio project management software it allows manage many projects with multi gantt chart.
Gantt charts for planning and scheduling projects
ConceptDraw PROJECT is an excellent simple project scheduling software. It maintain classic project gantt charts and the line of professional reports on resources usage. It include handy critical path scheduling software tools and diagraming tools which helps prepare the presentation of project status. It include project tracking dashboard to keep project metrics upto date, also it have handy feature to export project management dashboard in excel file.Bar Diagrams for Problem Solving. Create event management bar charts with Bar Graphs Solution
Create bar charts for event management problem solving and visual data comparison using the ConceptDraw PRO diagramming and vector drawing software extended with the Bar Graphs Solution from the Graphs and Charts area of ConceptDraw Solition Park.How to Create Presentation of Your Project Gantt Chart
During the planning, discussing and execution of a project you may need to prepare a presentation using project views such as the Gantt Chart, Multiproject Dashboard or Resource Usage View. It’s easy do with ConceptDraw PROJECT!What is Gantt Chart (historical reference)
Historical reference about the Gantt chart.Project — Working With Tasks
A full-featured project management solution with all the necessary functions right at your fingertips. Generates an extensive variety of reports on project and task statuses. These videos provide a series of lessons that will enhance the understanding of all our users, from people just starting out with the software, through to expert users.Product Overview
ConceptDraw PROJECT is a vigorous tool for managing single or multiple projects. It lets you determine all essential elements involved into project, control schedules, resources and finances, and monitor projects' progress in most effective yet simple manner.Managing the task list
Four lessons explaining how to manage your task list in a Gantt chart. You will learn how to adjust your Gantt chart view, how to add/delete tasks or subtasks, how to change tasks hierarchy, how to show/hide subtasks.Advanced printing in ConceptDraw Project
ConceptDraw PROJECT has flexible print settings that allowing you to easily print your project data to suite any need.Software development with ConceptDraw Products
Internet solutions on ConceptDraw base. What may interest developers of Internet solutions.- What Is The Difference Between Gantt Parallel Bar Chart Sequential
- Difference Between Gant Bar Chart And Critical Path Method
- Gant Chart in Project Management | Projects HR dashboard | How to ...
- Difference Between Flow Chart And Pie Chart
- What Is The Difference Between Flow Chart And Pie Chart
- Describe The Differences Between A Gantt Chart And A Pert Cpm
- Difference Between Bar Chart And Cpm
- Gant Chart in Project Management
- Process Flowchart | Difference Between Gantt
- How to Create Presentation of Your Project Gantt Chart | Gantt Chart ...
- Gantt Chart Diagram | How to Make a Mind Map from a Project Gantt ...
- Open Source Gantt Chart Software
- How to Create Presentation of Your Project Gantt Chart | Gantt Chart ...
- Gant Chart in Project Management | How to Create Presentation of ...
- Business Report Pie. Pie Chart Examples | Examples of Flowcharts ...
- What is Gantt Chart (historical reference) | Gantt chart examples ...
- Gantt Chart Diagram | How to Support Your Mind Map with Visual ...
- SWOT Analysis | ConceptDraw MINDMAP: Brainstorming, Mind ...
- Basketball Court Diagram and Basketball Positions | Basketball ...
- Dashboard | How to Track Your Project Plan vs. the Actual Project ...


