HelpDesk
How to Change the Timescale in a Gantt Chart View
Most views in ConceptDraw PROJECT Server have a timescale that shows the units of project time measurement (hour, day, week, etc.) used to schedule project tasks. You can change the timescale to view smaller or bigger time units, from hours all the way up to years. For example, you may want to show time in quarterы of the yearб or you may want to show a Gantt chart across months and days.How to Create Gantt Chart
To begin managing a new project, you will need to define the individual Tasks that must be completed to deliver it. The default view for a new project in ConceptDraw PROJECT is the Gantt Chart.HelpDesk
How to Add a Color Marker to Project Task on a Gantt Chart
ConceptDraw PROJECT Server allows adding color markers to scheduled project tasks. A color marker is used to show whether a task is marked for further action or identification of some kind. You can use markers if you want to select certain tasks for further viewing, filtering, formatting, or editing in the offline mode.HelpDesk
How to Export Project Data to MS Excel Worksheet
You can share your ConceptDraw PROJECT files with colleagues who use MS Excel®using the export capabilities of the PROJECT.Gantt Chart Software
The Gantt Chart is the main interface in ConceptDraw PROJECT. It summarizes the tasks in your project and presents them graphically so you can easily view your progress.Gane Sarson Diagram
The vector stencils library Gane-Sarson Notation from the solution Data Flow Diagrams contains specific symbols of the Gane-Sarson notation such as process symbol, connector symbol, jump symbol for ConceptDraw DIAGRAM diagramming and vector drawing software. The Data Flow Diagrams solution is contained in the Software Development area of ConceptDraw Solution Park.
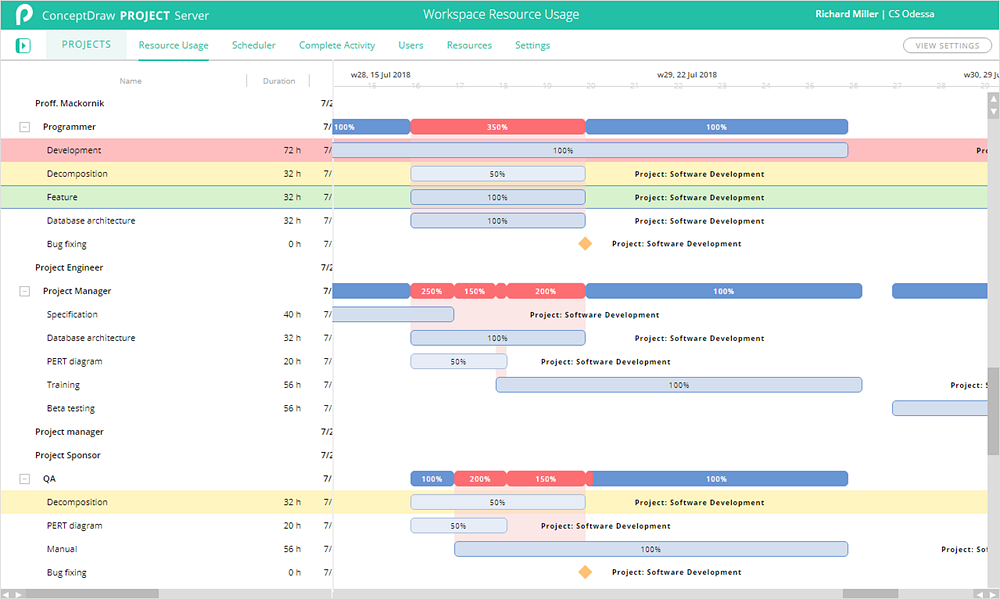
Project — Working With Costs
ConceptDraw PROJECT delivers a rich set of built-in functionalities and optional product extensions that support your daily workflow in time-saving and creative ways. This video lesson will teach you how to work with costs in your project document.How to Create Presentation of Your Project Gantt Chart
During the planning, discussing and execution of a project you may need to prepare a presentation using project views such as the Gantt Chart, Multiproject Dashboard or Resource Usage View. It’s easy do with ConceptDraw PROJECT!How to Report Task's Execution with Gantt Chart
ConceptDraw PROJECT’s powerful reporting engine lets you generate a set of tabular reports with just one click, or visualize your project as Radial Tasks Structures, Work Breakdown Structures and Resource Calendars. It also provides you with dynamic Project Dashboards.Gant Chart in Project Management
Gant Chart is a graphical representation of tasks as segments on a time scale. It helps plan and monitor project development or resource allocation. The horizontal axis is a time scale, expressed either in absolute or relative time.- Gantt Chart Excel Online
- Online Chart Maker From Excel
- How To Convert Gantt Chart Into Pert Chart
- Gantt Chart Generator
- Process Flowchart | Diff B W Gaintt Chart And Pert Chart In Tabular ...
- How to Make a Mind Map from a Project Gantt Chart | Online ...
- Mindmap Free Online Gantt Chart
- ERD | Entity Relationship Diagrams, ERD Software for Mac and Win
- Flowchart | Basic Flowchart Symbols and Meaning
- Flowchart | Flowchart Design - Symbols, Shapes, Stencils and Icons
- Flowchart | Flow Chart Symbols
- Electrical | Electrical Drawing - Wiring and Circuits Schematics
- Flowchart | Common Flowchart Symbols