How to Discover Critical Path on a Gantt Chart
ConceptDraw PROJECT is the Gantt chart software that implements critical path method to provide the user with a wide set of project management tools.Gane Sarson Diagram
The Gane-Sarson methodology uses the graphical techniques for building the logical models for the systems. It is helpful for analysts and designers to make common and clear picture of the system, to depict all its processes and how they transform the data. The Gane-Sarson methodology lets represent all this information in a way understandable for the users and other interested people, and gives the possibility to see instantly how the system's parts serve together to meet their needs. This methodology supposes the building of a system top-down. First you need create an overall system data flow, then determine the details of the data structures, the process logic and design the modular structures. ConceptDraw DIAGRAM diagramming and vector drawing software offers the Data Flow Diagrams solution with Gane-Sarson Notation library rich for the specific symbols of the Gane-Sarson notation. All they are vector and fully ready-to-use for drawing the Data Flow Diagrams, which will be then successfully used in presentations, websites, and various business documents.Sales Process Flowchart. Flowchart Examples
Sales Process Flowchart is an invaluable tool for business. It gives you opportunity to visualise and better understand the sales process, reveal and also visually highlight issues or bottlenecks, and predict the number of sales. The Flowchart is ideal method to represent in details all steps of the process, tasks and decisions needed to obtain maximum effectiveness and success. The steps are graphically represented by boxes linked with arrows indicating direction of the workflow, decision is shown by diamond. The sales process is closely linked to the company's success and usually includes the following main steps: Product knowledge, Prospecting, Planning the sale (Pre-approach), Approach, Need assessment, Presentation, Meeting objections, Gaining commitment, Follow-up. Create fast and easy your own Flowcharts of sales business processes using the ConceptDraw DIAGRAM ector graphic software extended with Cross-Functional Flowcharts solution from Business Processes area and also Sales Flowcharts solution from Marketing area of ConceptDraw Solution Park.Visual Presentations Made Easy with Diagramming Software
Automatically create a presentation-quality diagram in one click with ConceptDraw DIAGRAM.
Sales Process Map
You need create a Sales Process Map? Use the ConceptDraw DIAGRAM software which is ideal for the sales process management, marketing and engineering thanks to the powerful Sales Flowcharts solution from the Marketing area of ConceptDraw Solution Park.Planogram Software and Retail Plan Software
The ConceptDraw DIAGRAM Planogram Software and Retail Plan Software offers powerful tools of Enterprise Architecture Diagrams Solution for visualization the market analysis and easy making successful Retail Plans and Planograms with useful detailed recommendations about placing products and optimization the shelf space.Orgchart
Workforce planning is strategically important for each company, organization, enterprise, and corporation, non important it is business, commercial, non-profit or government organization. Organizational Chart or Orgchart is a type of diagram that is successfully used to graphically illustrate the structure of an organization and also relationships between its parts. There are three different types of Orgcharts: hierarchical, matrix and flat. ConceptDraw DIAGRAM diagramming and vector drawing software supplied with Organizational Charts Solution from Management Area is the best for easy designing professional-looking Orgcharts. This solution provides you the predesigned samples and Organizational Chart library with ready-to-use vector objects required for Orgchart design. It also offers the most simple way of drawing - the possibility to start with one of built-in Orgchart templates. Typically Orgcharts require for regular updating and making modifications, in ConceptDraw DIAGRAM it is fast and easy, the blocks are editable and remain connected when they are moved.Online Marketing Objectives
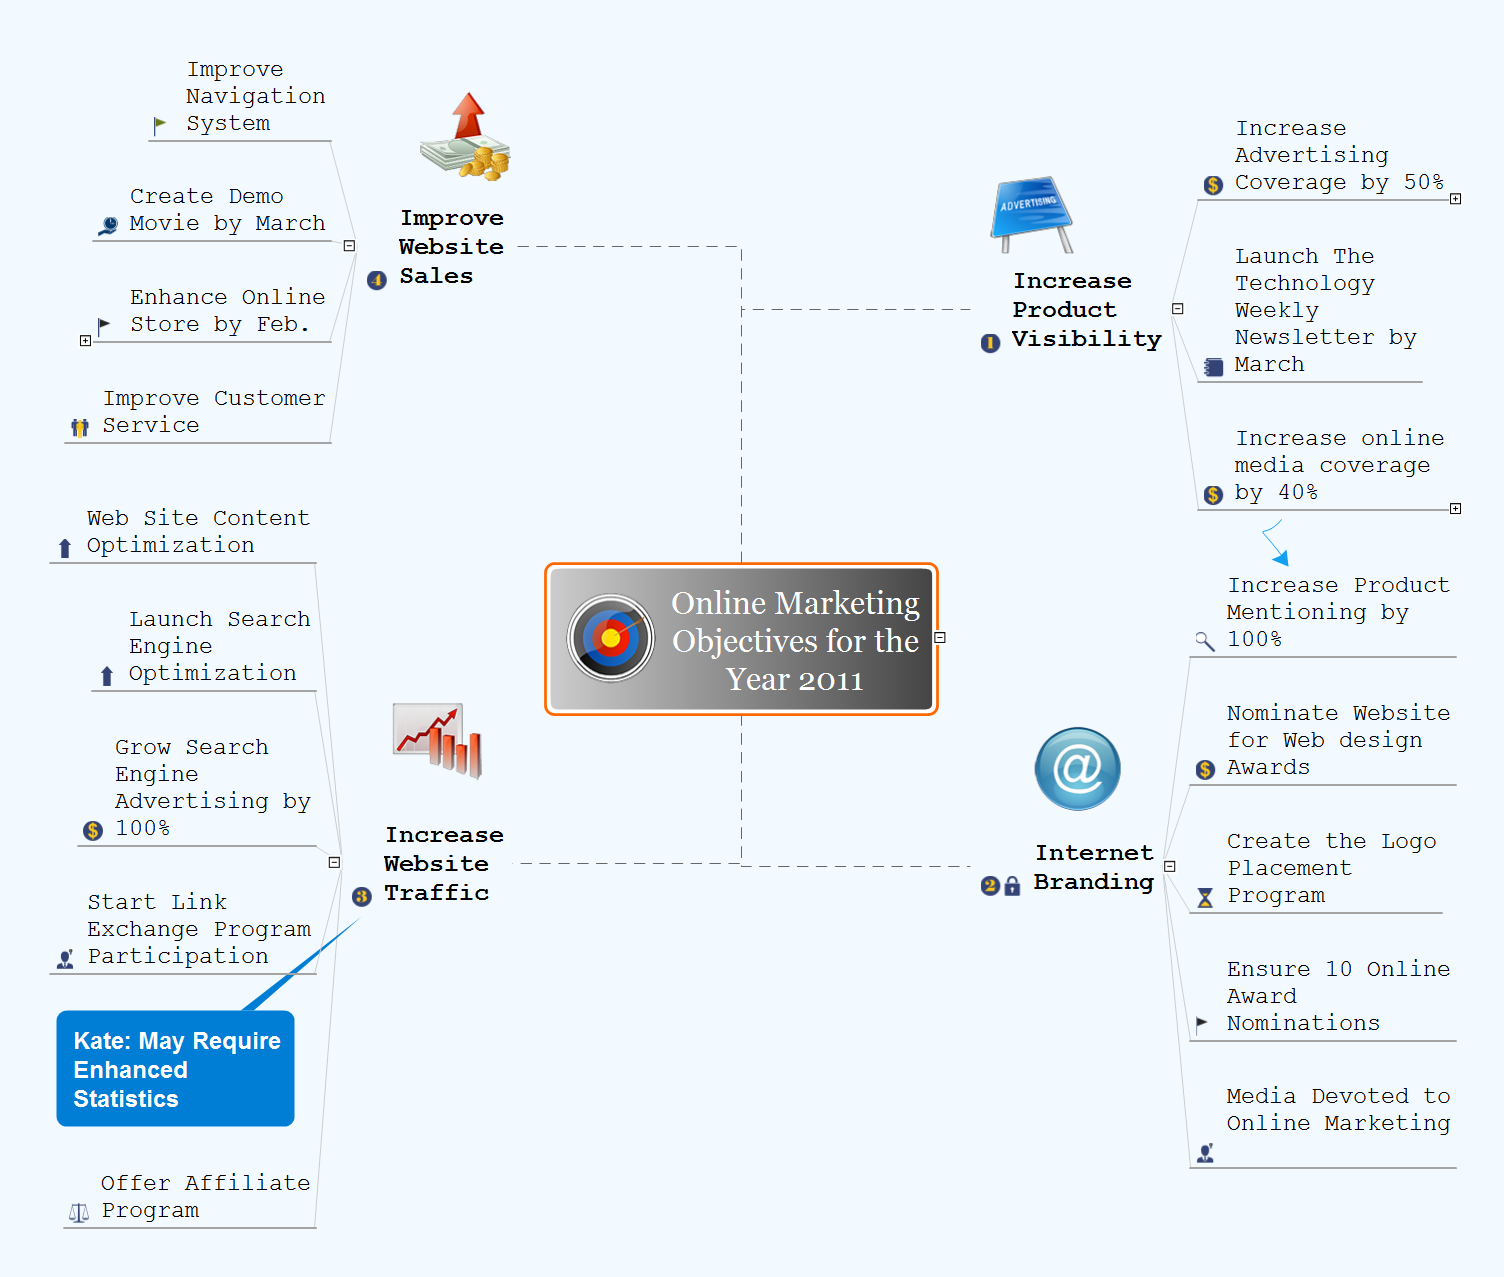
Promotion and sale of goods or services, as well as the conquest of free niche on the market in a given category include numerous methods directed on the advertising the products and attraction attention of potential buyers. Among them are traditional methods of struggle for the buyer, as well as internet marketing or online marketing, that is a complex of measures aimed at attraction of clients using the online technologies. The main tool of online marketing is a website of the company. The proper preparation and promotion of website ensure to the owner the opportunity to successfully compete with manufacturers of similar products, ensuring the high sales. Today each manufacturer, regardless of the size and direction of activities, creates a website, online store, blog, pages in social networks that give the visitors full information about the company, its products and services. Given the fact that a potential buyer spends a lot of time at the Internet, such strategy is justified and the practice shows a high efficiency of online marketing. ConceptDraw MINDMAP helps to illustrate a value of outline marketing on a Mind Map, to represent the online marketing objectives for a company and to specify the targets outlined for each of these objectives.How To Plan and Implement Projects Faster
ConceptDraw Office is the most effective tool for planning, tracking, and reporting all types of projects with strong management capabilities, user friendly functionality, and superior ease of use. In this tutorial video we will assist you in planning and managing a project using ConceptDraw Office.- Gantt Chart Of Online Shopping System
- Gantt Chart For Online Ordering System
- Pert Chart For Online Shopping Project
- Gantt Chart For Online Shopping System
- Pert Chart Diagram In Online Shopping Project
- Rapid UML | Sdlc Example For Online Shopping System
- Online Shopping Gantt Chart
- Gantt Chart Of On Line Shopping Project
- Shopping Mall Construction Detailed Gantt Chart
- Example of DFD for Online Store (Data Flow Diagram ) DFD ...


