This site uses cookies. By continuing to browse the ConceptDraw site you are agreeing to our Use of Site Cookies.

Gantt Chart

The visual reports are the godsend for project management, they help represent the strict numbers and data about the results of project execution in a clear, visual and profitable view. They give the perfect ability to identify and display the most important data on one diagram, they let easily observe the project on different levels of detailing, demonstrate the project attributes, properties and other parameters.

ConceptDraw Solution Park ConceptDraw Solution Park

ConceptDraw Solution Park
ConceptDraw Solution Park collects graphic extensions, examples and learning materials

How to Discover Critical Path on a Gantt Chart

ConceptDraw PROJECT is the Gantt chart software that implements critical path method to provide the user with a wide set of project management tools.
HelpDesk

How to Create a Gantt Chart for Your Project

Instruction on how to create Gantt chart using ConceptDraw PROJECT software. Gant Chart is a graphical representation of tasks as segments on a time scale. It helps plan or overlapping.

 pert chart, project management chart, network diagram project management, pert diagram, precedence diagram, project timeline, gantt diagram, project network diagram, gantt chart Project Diagrams

 pert chart, project management chart, network diagram project management, pert diagram, precedence diagram, project timeline, gantt diagram, project network diagram, gantt chart
The Project Diagrams solution extends the ConceptDraw DIAGRAM software functionality with special tools, large set of samples pre-made in ConceptDraw DIAGRAM and ConceptDraw MINDMAP, and collection of predesigned vector shapes, arrows, table and frame objects for easy drawing the Project Diagrams of different kinds, Hierarchical Charts, Influence Diagrams, Work Breakdown Structures (WBS), Organization Breakdown Structures (OBS), and Resource Breakdown Structures (RBS), PERT Chart or PERT Diagram, Project Management Chart, Project Network Diagram, Network Diagram Project Management, Project Timeline, Precedence Diagram, Gantt Diagram or Gantt Chart. Plan your project, visualize the main stages, and track your project’s implementation effectively with ConceptDraw DIAGRAM. Use also ability to autogenerate Project Diagrams from ConceptDraw MINDMAP to ConceptDraw DIAGRAM.
HelpDesk

How to Add a Color Marker to Project Task on a Gantt Chart

ConceptDraw PROJECT Server allows adding color markers to scheduled project tasks. A color marker is used to show whether a task is marked for further action or identification of some kind. You can use markers if you want to select certain tasks for further viewing, filtering, formatting, or editing in the offline mode.
HelpDesk

How to Draw a Gantt Chart

A Gantt chart is intended to provide a visualization of a project schedule. It is developed to help planning, coordinating, and tracking on project tasks implementation. One of the most critical resources for project implementation are time resources. Gantt chart - is one of the most convenient and popular ways of graphical representation of a project tasks progress in conjunction with the corresponding time consumption. Gantt chart's function is to show project tasks completed in progress and to make a project manager sure that project tasks were completed on time. ConceptDraw Office is a clear and easy-to-use tool for project management. It is a very handy visual tool that helps make a project processing clear.

Program Evaluation and Review Technique (PERT) with ConceptDraw DIAGRAM

Program Evaluation and Review Technique (abbr. PERT) is a method developed by Ministry of Defense of the USA in 1958 for the project of creation the missile system Polaris. PERT diagram is one of the tools for project management that lets greatly simplify the planning and scheduling of large and complex projects. PERT diagram provides evaluation of project run-time and labor forces, it helps to analyze the time necessary for execution each of project tasks and the whole project, and to calculate the project critical path. PERT chart depicts the set of tasks connected each other in order of their execution and is constructed according to one of definite rules - AOA (activity on arrow) or AON (activity on node). It doesn't give you ready concrete decisions, but helps to find them. Design easy the PERT diagrams in ConceptDraw DIAGRAM software enhanced with Seven Management and Planning Tools solution from Management area of ConceptDraw Solution Park. You have a possibility to build the PERT chart of any type, but AON variant is easier for building and perception.

Flow Chart Online

Flow Chart is a great visualization tool for the flow of a process, algorithm or procedure with a lot of benefits. It is convenient to use a powerful software for creating flow charts. Now we have the best flow chart maker online design software - ConceptDraw DIAGRAM enhanced with Flowcharts Solution from the "Diagrams" Area of ConceptDraw Solution Park.

Computer Hardware - Reseller Business Plan

When developing a business plan it is very important to accurately represent the structure and visually outline all important information. A business plan usually has a clear hierarchical structure. The Mind Maps are particularly effective to describe such structures, they are one of the most powerful and visually intuitive tools for the tasks of structuring and memorizing large amounts of information. The Mind Maps are indispensable in development the complex projects, in preparation and discussion of business plans, in designing the presentations, in process of decision making, holding brainstorming, time management, etc. As for the software for working with Mind Maps, particularly effective is a cross-platform ConceptDraw MINDMAP software for Windows and Mac OS X. It provides many tools that help in business plan preparation for organizing the new business, in developing a business plan for promotion some product, etc. ConceptDraw MINDMAP supports the multipage documents, the export and import into popular applications MS PowerPoint, MS Word, PDF, MindManager, in project management applications ConceptDraw Project and MS Project, and in various graphical formats. You can to observe a Mind Map of a business plan for computer hardware reseller designed in ConceptDraw MINDMAP.
HelpDesk

How to Make a Mind Map from a Project Gantt Chart

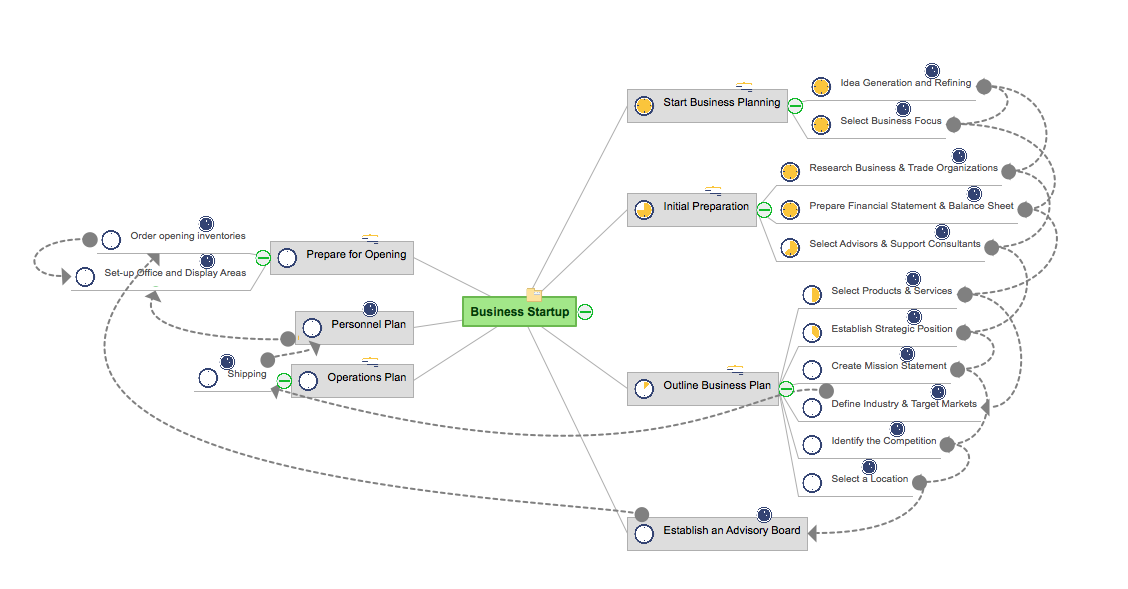
ConceptDraw Office allows you to see the project data from ConceptDraw PROJECT in a mind map structure by opening your project in ConceptDraw MINDMAP.

How To Create Project Report

ConceptDraw PROJECT contains an extensive tool set to help project managers. The rich data visualization capability that is provided by ConceptDraw products helps you create project dashboards, one-click reports, multi-project views, Gantt charts, and resource views. Let′s learn how to get maximum value using ConceptDraw PROJECT!

Project —Task Trees and Dependencies

Users new to ConceptDraw PROJECT will find the Basic lessons an essential platform for familiarizing themselves with the program′s functions. This video lesson will teach you how to set up task trees and dependencies.

Chart Templates

Easy charting software comes with beautiful chart templates and examples. This makes it easy to create professional charts without prior experience.