Gant Chart in Project Management


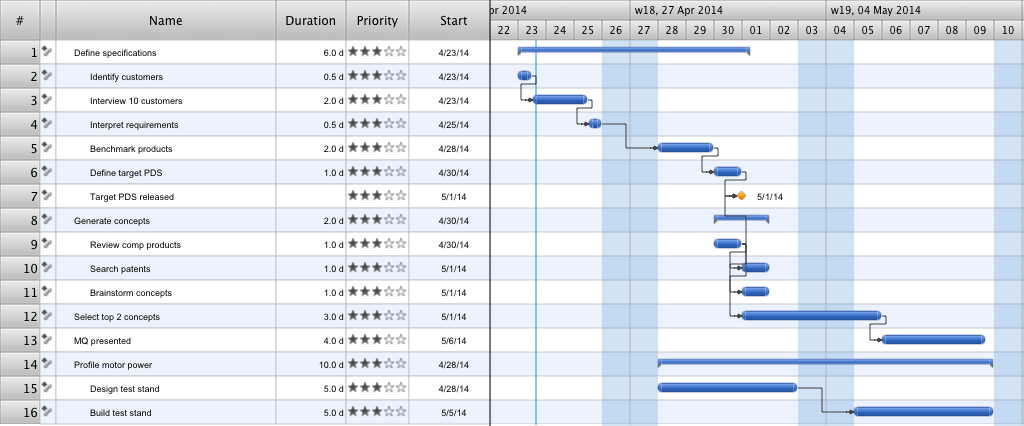
Gantt chart examples

What Constitutes a Project?

Gantt chart examples
What is Gantt Chart (historical reference)

Gantt charts for planning and scheduling projects

How to Report Task's Execution with Gantt Chart

Gantt Chart Templates
How to Create Presentation of Your Project Gantt Chart

How to Create Gantt Chart

- Gantt chart examples | Online Marketing Objectives | Gant Chart in ...
- Sample Gantt Chart For Marketing Plan
- Product Marketing Gantt Chart
- Marketing Product Launch Gantt
- | How to Report Task's Execution with Gantt Chart | Wbs Marketing ...
- Marketing Plan Gantt Chart
- HVAC Marketing Plan | Flowchart Example: Flow Chart of Marketing ...
- Marketing Plan Process Gantt
- Marketing Gantt Chart
- How to Report Task's Execution with Gantt Chart | How to Create ...