This site uses cookies. By continuing to browse the ConceptDraw site you are agreeing to our Use of Site Cookies.

Process Flowchart

The main reason of using Process Flowchart or PFD is to show relations between major parts of the system. Process Flowcharts are used in process engineering and chemical industry where there is a requirement of depicting relationships between major components only and not include minor parts. Process Flowcharts for single unit or multiple units differ in their structure and implementation. ConceptDraw DIAGRAM is Professional business process mapping software for making Process flowcharts, Process flow diagram, Workflow diagram, flowcharts and technical illustrations for business documents and also comprehensive visio for mac application. Easier define and document basic work and data flows, financial, production and quality management processes to increase efficiency of your business with ConcepDraw DIAGRAM. Business process mapping software with Flowchart Maker ConceptDraw DIAGRAM includes extensive drawing tools, rich examples and templates, process flowchart symbols and shape libraries, smart connectors that allow you create the flowcharts of complex processes, process flow diagrams, procedures and information exchange. Process Flowchart Solution is project management workflow tools which is part ConceptDraw Project marketing project management software. Drawing charts, diagrams, and network layouts has long been the monopoly of Microsoft Visio, making Mac users to struggle when needing such visio alternative like visio for mac, it requires only to view features, make a minor edit to, or print a diagram or chart. Thankfully to MS Visio alternative like ConceptDraw DIAGRAM software, this is cross-platform charting and business process management tool, now visio alternative for making sort of visio diagram is not a problem anymore however many people still name it business process visio tools.
How To Create a Process Flow Chart (business process modelling techniques)
"Dimensions of service quality.
A customer's expectation of a particular service is determined by factors such as recommendations, personal needs and past experiences. The expected service and the perceived service sometimes may not be equal, thus leaving a gap. The service quality model or the ‘GAP model’ developed by a group of authors- Parasuraman, Zeithaml and Berry at Texas and North Carolina in 1985 , highlights the main requirements for delivering high service quality. It identifies five ‘gaps’ that cause unsuccessful delivery. Customers generally have a tendency to compare the service they 'experience' with the service they 'expect' . If the experience does not match the expectation , there arises a gap. Ten determinants that may influence the appearance of a gap were described by Parasuraman, Zeithaml and Berry. in the SERVQUAL model: reliability, responsiveness, competence, access, courtesy, communication, credibility, security, understanding the customer and tangibles.
Later, the determinants were reduced to five: tangibles; reliability; responsiveness; service assurance and empathy in the so called RATER model." [Service quality. Wikipedia]
The block diagram example "Gap model of service quality" was created using the ConceptDraw PRO diagramming and vector drawing software extended with the Block Diagrams solution from the area "What is a Diagram" of ConceptDraw Solution Park.
Block diagram
Block diagram, block diagram,

Types of Flowcharts

A Flowchart is a graphical representation of process, algorithm, workflow or step-by-step solution of the problem. It shows the steps as boxes of various kinds and connects them by arrows in a defined order depicting a flow. There are twelve main Flowchart types: Basic Flowchart, Business Process Modeling Diagram (BPMN), Cross Functional Flowchart, Data Flow Diagram (DFD), IDEF (Integrated DEFinition) Flowchart, Event-driven Process Chain (EPC) Diagram, Influence Diagram (ID), Swimlane Flowchart, Process Flow Diagram (PFD), Specification and Description Language (SDL) Diagram, Value Stream Mapping, Workflow Diagram. Using the Flowcharts solution from the Diagrams area of ConceptDraw Solution Park you can easy and quickly design a Flowchart of any of these types. This solution offers a lot of special predesigned vector symbols for each of these widely used notations. They will make the drawing process of Flowcharts much easier than ever. Pay also attention for the included collection of ready Flowchart examples, samples and quick-start templates. This is business process improvement tools. If you are looking for MS Visio for your Mac, then you are out of luck, because it hasn't been released yet. However, you can use Visio alternatives that can successfully replace its functions. ConceptDraw DIAGRAM is an alternative to MS Visio for Mac that provides powerful features and intuitive user interface for the same.
How to Simplify Flow Charting

block diagram, function blocks Block Diagrams

block diagram, function blocks
Block diagrams solution extends ConceptDraw DIAGRAM software with templates, samples and libraries of vector stencils for drawing the block diagrams.

systems engineering, sysml SYSML

systems engineering, sysml
The SysML solution helps to present diagrams using Systems Modeling Language; a perfect tool for system engineering.

Risk Diagram (Process Decision Program Chart)

The risk is a probable event in result of which may occur the negative events and adverse consequences. The risk management is a very important process in any field, it is a process of making the management decisions aimed on the reducing the likelihood of appearing the unfavorable results and on the minimizing potential losses, as well as the implementation of these solutions. The main purpose of applying the risk management is increasing of enterprise's competitiveness with help of protection against the risks. ConceptDraw MINDMAP software is perfect for identifying the risks, analyzing and managing risks, for designing Risk Diagrams, for developing effective actions in response to circumstances and potential obstacles that were identified as risks. It is also the best for designing Process Decision Program Charts and representing the PDPC method, which is effective way of detailed planning and depiction the whole sequence of actions on the path from the formulation a problem to its solution. The PDPC lets determine the risks when corrective actions are not performed correctly and helps develop descriptions for preventive actions.

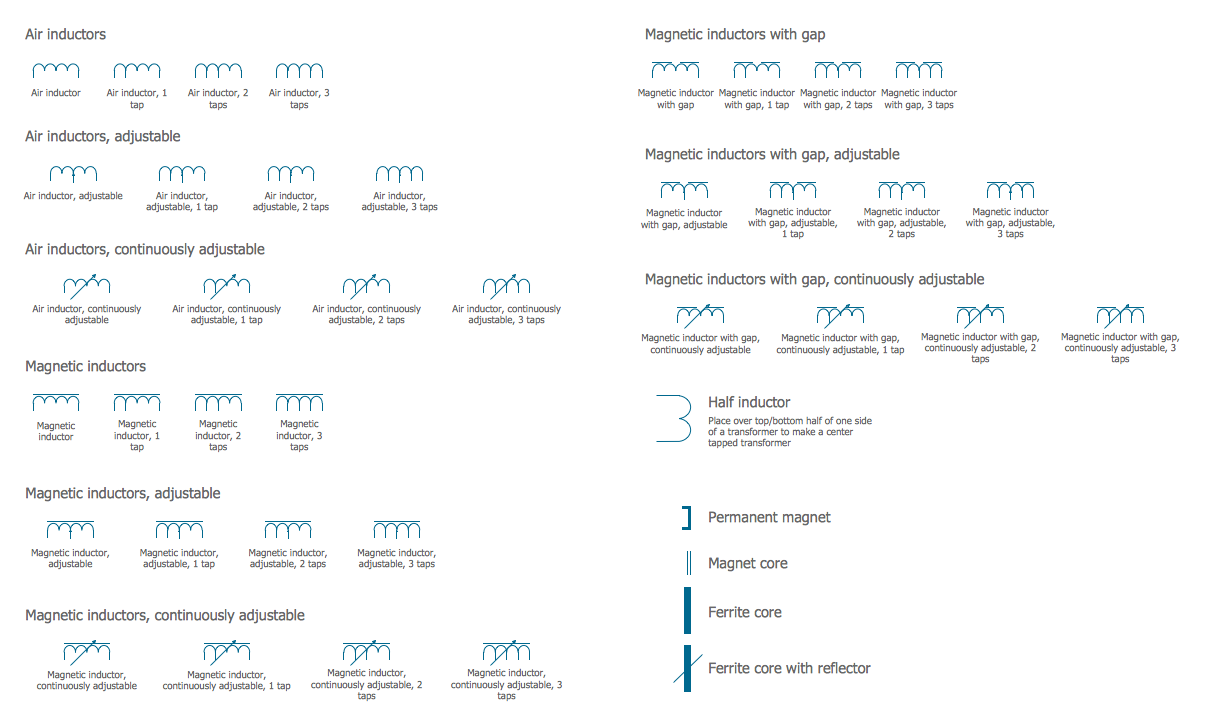
Electrical Symbols — Inductors

An inductor, also called a coil or reactor, is a passive two-terminal electrical component which resists changes in electric current passing through it. It consists of a conductor such as a wire, usually wound into a coil. Energy is stored in a magnetic field in the coil as long as current flows. When the current flowing through an inductor changes, the time-varying magnetic field induces a voltage in the conductor, according to Faraday’s law of electromagnetic induction. 26 libraries of the Electrical Engineering Solution of ConceptDraw DIAGRAM make your electrical diagramming simple, efficient, and effective. You can simply and quickly drop the ready-to-use objects from libraries into your document to create the electrical diagram.

Electrical Symbols — Electrical Circuits

A circuit diagram or wiring diagram uses symbols to represent parts of a circuit. Electrical and electronic circuits can be complicated. Making a drawing of the connections to all the component parts in the circuit's load makes it easier to understand how circuit components are connected. Drawings for electronic circuits are called "circuit diagrams". Drawings for electrical circuits are called "wiring diagrams". 26 libraries of the Electrical Engineering Solution of ConceptDraw DIAGRAM make your electrical diagramming simple, efficient, and effective. You can simply and quickly drop the ready-to-use objects from libraries into your document to create the electrical diagram.

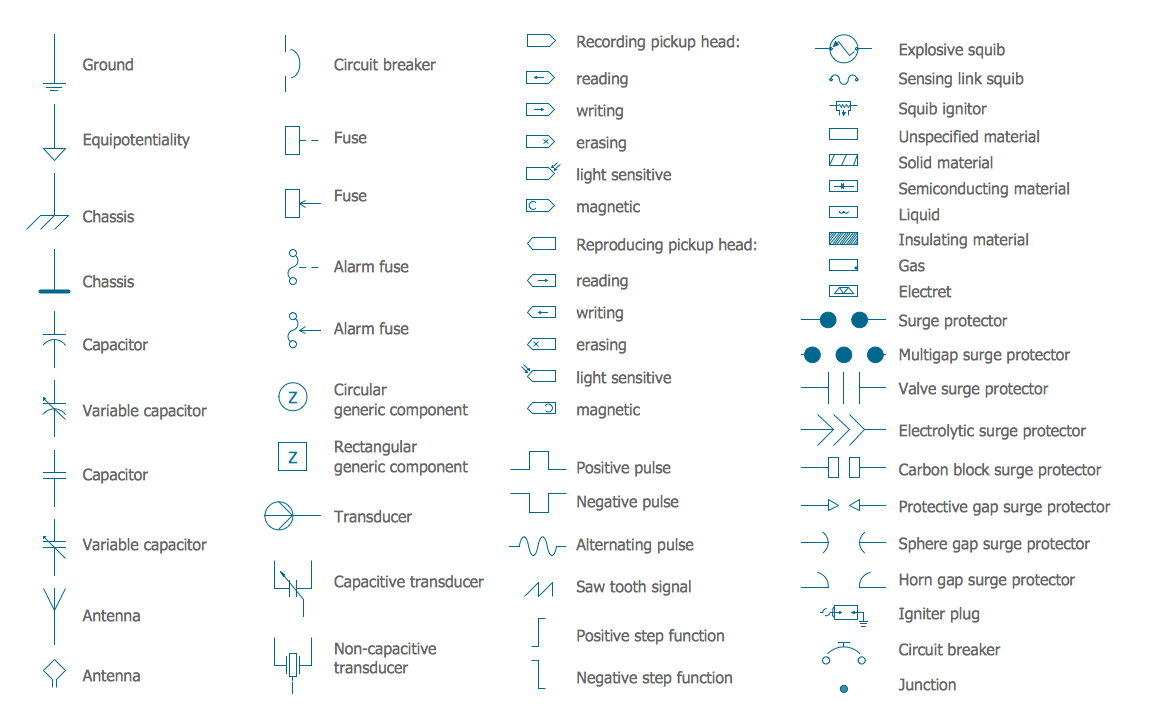
Electrical Symbols, Electrical Diagram Symbols

When drawing Electrical Schematics, Electrical Circuit Diagrams, Power Systems Diagrams, Circuit and Wiring Diagrams, Digital and Analog Logic Schemes, you will obligatory need the electrical symbols and pictograms to represent various electrical and electronic devices, such as resistors, wires, transistors, inductors, batteries, switches, lamps, readouts, amplifiers, repeaters, relays, transmission paths, semiconductors, generators, and many more. Today these symbols are internationally standardized, so the diagrams designed using them are recognizable and comprehensible by specialists from different countries. Electrical Engineering Solution included to ConceptDraw Solution Park provides 26 libraries with 926 commonly used electrical schematic and electrical engineering symbols making the reality the easy drawing of Electrical diagrams, schematics and blueprints. Now you need only a few minutes to create great-looking Electrical diagram, simply choose required electrical design elements from the libraries, drag them on the needed places at the document and connect in a suitable way.