Value Stream Diagram
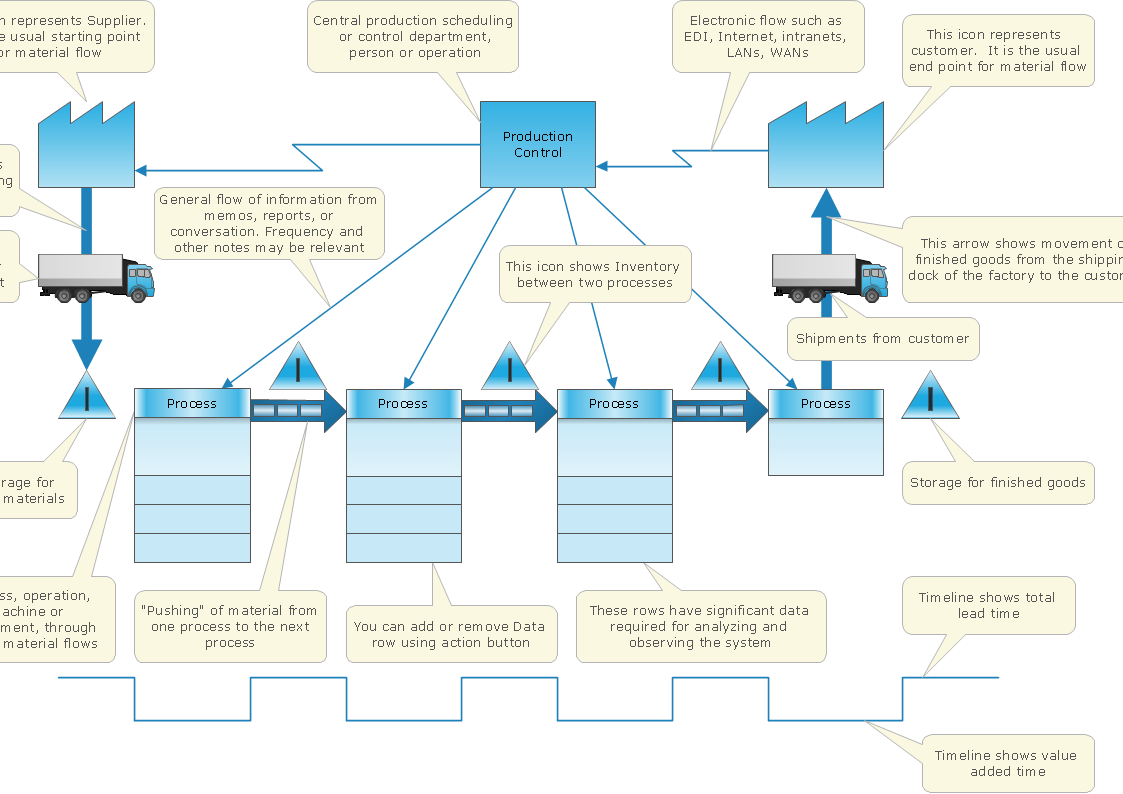
The new Value Stream Mapping solution found in the ConceptDraw Solution Park continues to extend the range of ConceptDraw PRO into a business graphics tool.What is Value Stream Mapping?
Value stream maps (VSM) are an essential tool for organizations applying Lean methods.Value Stream Analysis
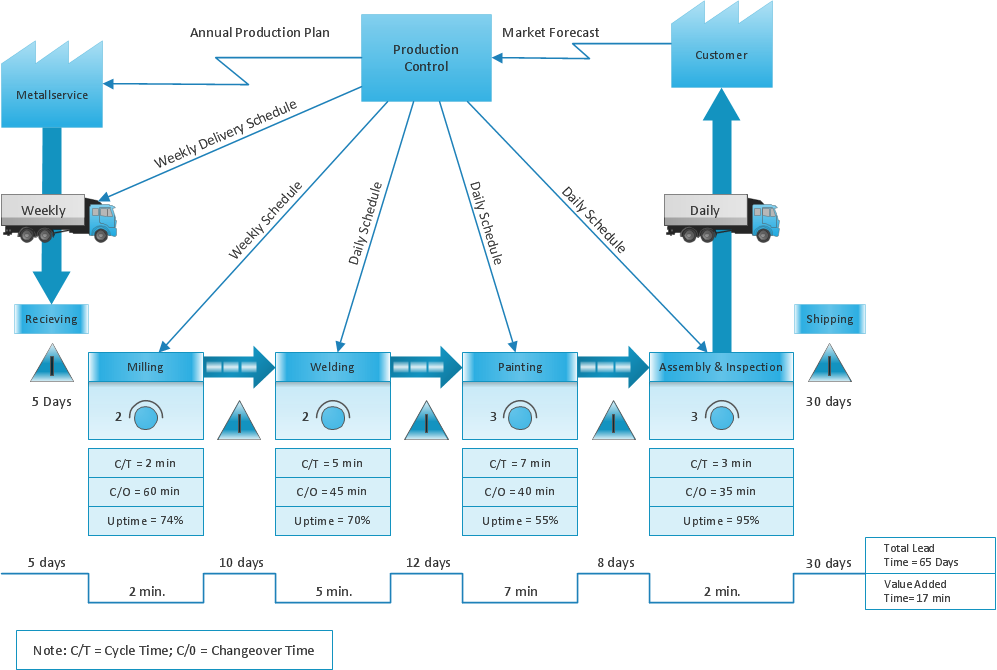
ConceptDraw Value Stream Maps are used in lean practice for analysis of manufacturing processes to identify the improvement opportunities.Value Stream Mapping and Analysis
Value Stream Maps are used in lean methodology for analysis of manufacturing process and identification of the improvement opportunities.Value Stream Mapping
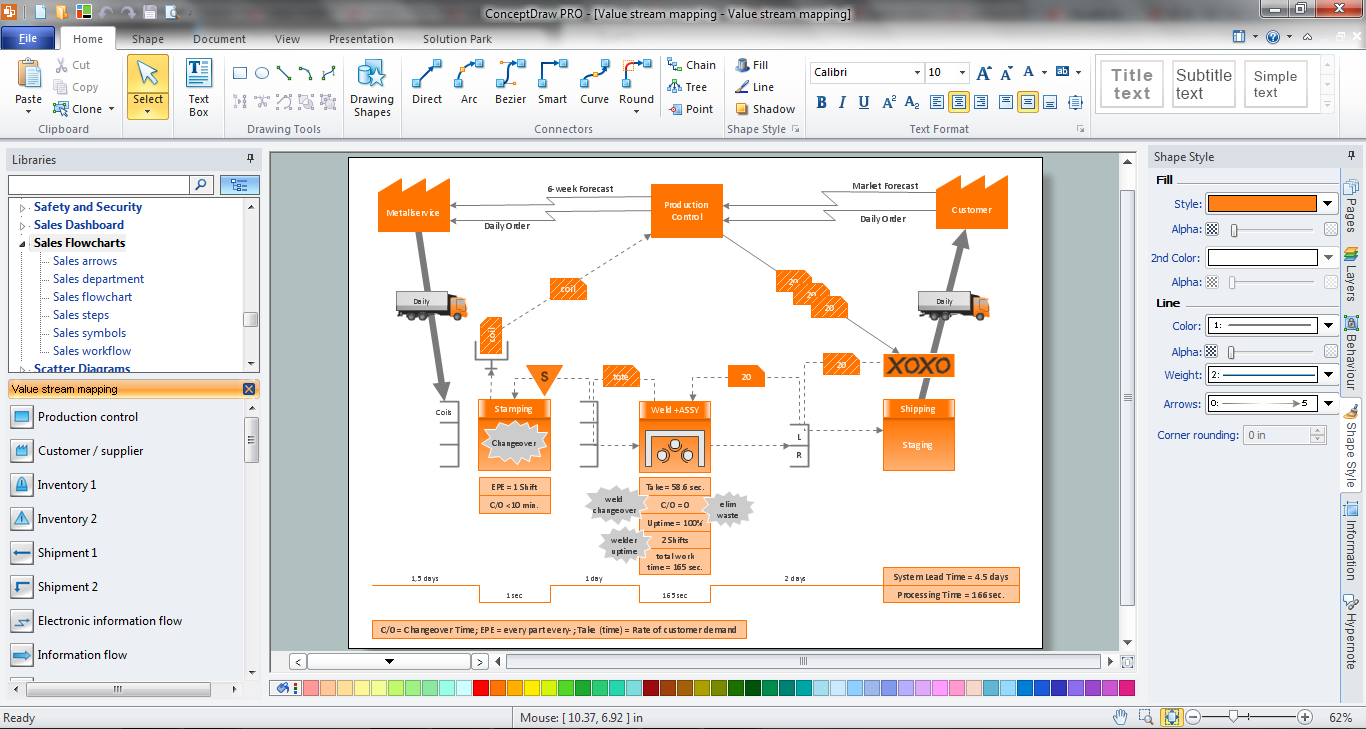
Use ConceptDraw Value Stream Maps (VSM) visualization for a manufacturing plant the material and information flow required to deliver a product/service to customers. The new Value Stream Mapping solution found in the ConceptDraw Solution Park continues to extend the range of ConceptDraw PRO into a business graphics tool that can be used to document processes in any organization.Create a Value Stream Map Rapidly
The Value Stream Mapping solution from ConceptDraw Solution Park extends ConceptDraw PRO software with a new library that contains vector objects, samples and templates.Best Value — Total Quality Management
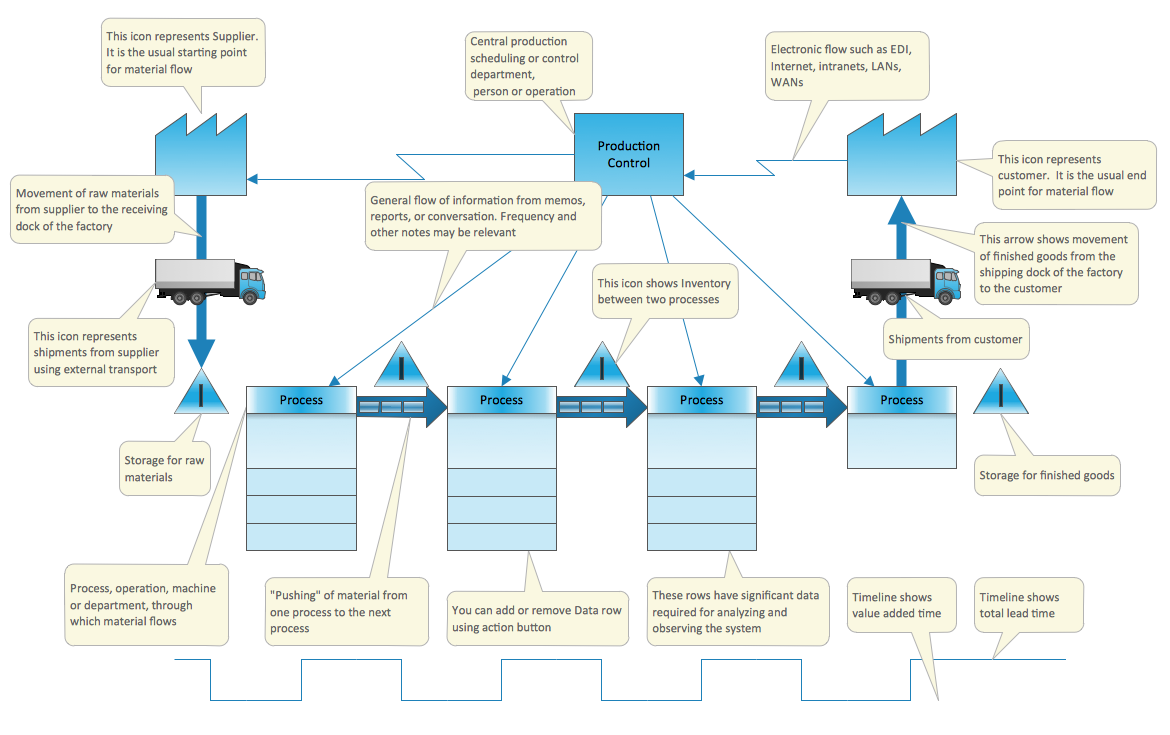
The Total Quality Management Diagram solution helps your organization visualize business and industrial processes. Create Total Quality Management diagrams for business process with ConceptDraw software.Sections of the Value Stream Map
The Value Stream Mapping solution extends ConceptDraw PRO software with a new library that contain vector objects, samples and templates.State Diagram Example - Online Store
This sample was created in ConceptDraw PRO diagramming and vector drawing software using the UML State Mashine Diagram library of the Rapid UML Solution from the Software Development area of ConceptDraw Solution Park. This sample shows the work of the online store and can be used for the understanding of the online shopping processes, for projection and creating of the online store.Total Quality Management Value
The Total quality management (TQM) is an enterprise-wide method of continuous quality improvement of all organizational processes, including the enhancement of ability to deliver high-quality products and services to the customers. The TQM includes eight main elements, which have great value: customer-focused, process-centered, total employee involvement, integrated system, continual improvement, strategic and systematic approach, fact-based decision making, communications. ConceptDraw PRO diagramming and vector drawing software offers the Total Quality Management Diagram solution with effective drawing tools, predesigned vector elements, samples and templates that help easy design the Total Quality Management diagrams, TQM flowcharts and Mind Maps widely used in quality management projects to visualize the business processes and industrial processes for your organization, to demonstrate the quality control step-by-step in a visual manner, to compare visually the ideal and real stages of processes.- Payroll process - Swim lane process mapping diagram | Value ...
- Value Stream Analysis | What is Value Stream Mapping ? | Value ...
- Business Process Modeling Notation Template | Fishbone Diagrams ...
- Value Stream Mapping Examples Produc
- Value Stream Mapping Symbols | Standard Shapes for Value ...
- Basic Flowchart Images. Flowchart Examples | Manufacturing and ...
- Process Flowchart | 4 Ms fishbone diagram - Production process ...
- Basic Flowchart Images. Flowchart Examples | Value Stream ...
- Entity-Relationship Diagram (ERD) | Fishbone Diagrams | Value ...
- Data Flow Diagram Model | How Do Fishbone Diagrams Solve ...


