Garrett IA Diagrams with ConceptDraw DIAGRAM
Garrett IA diagrams are used at development of Internet-resources, in particulars at projecting of interactions of web-resource elements. The diagram of information architecture of the web resource which is constructed correctly with necessary details presents to developers the resource in comprehensible and visual way.Pyramid Diagram
The Time-Money-Quality Triangle illustrates an advertising truism, that you can't have all three.Amazon Web Services Diagrams diagramming tool for architecture
Amazon Web Services (AWS) offers the reliable and relatively inexpensive cloud computing services. This is the main reason why many large companies prefer to use the Amazon Cloud to storage and operate the data. ConceptDraw DIAGRAM diagramming software enhanced with AWS Architecture Diagrams solution provides the powerful AWS diagramming tools to draw the Amazon architecture diagrams and Amazon Web Services planning diagrams, to develop the Architect infrastructure based on AWS in a few minutes. The AWS Architecture Diagrams solution offers variety of built-in samples and templates for several Amazon Web Services products and resources, a wide range of predesigned and recognizable vector graphic icons used for simple designing the Architecture diagrams. The diagrams created in ConceptDraw DIAGRAM are professional-looking, helpful when designing and implementing the AWS infrastructure based systems, useful to communicate design, deployment and topology, and apposite for using in presentations, whitepapers, datasheets, posters, and other technical materials you like.Gantt charts for planning and scheduling projects
ConceptDraw PROJECT is an excellent simple project scheduling software. It maintain classic project gantt charts and the line of professional reports on resources usage. It include handy critical path scheduling software tools and diagraming tools which helps prepare the presentation of project status. It include project tracking dashboard to keep project metrics upto date, also it have handy feature to export project management dashboard in excel file.PROBLEM ANALYSIS. Identify and Structure Factors
Identify and Structure Factors. Use the Affinity Diagram to collect and structure factors that impact on a problem. ConceptDraw Office suite is a software for identify and structure factors with affinity diagram. This is a grouping and structuring of factors that impact on a problem.
Information Architecture
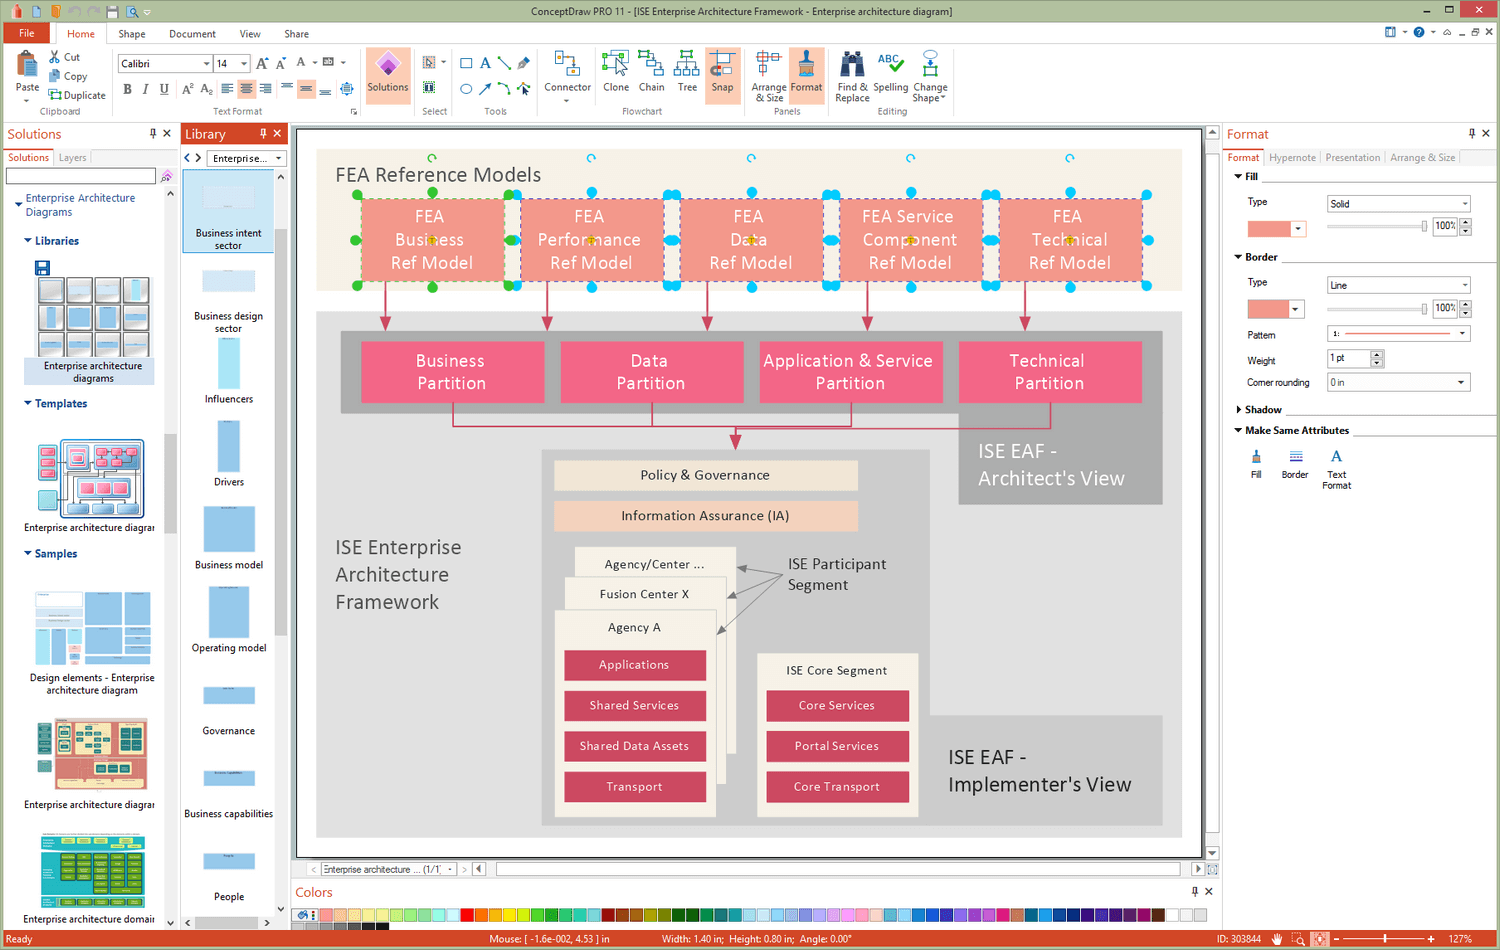
You want design the Information Architecture and need a powerful software for this? ConceptDraw DIAGRAM extended with Enterprise Architecture Diagrams Solution from the Management Area is exactly what you need.SWOT Analysis
Most of the data needed for market analysis (demand, prices, volume of sales, etc.) are undefined, and in future are possible their changes as in the worst and the best side. SWOT analysis is effective method for prediction these processes and decision making for organizations that function in a competitive environment. It allows you to see the whole situation, to identify the strengths and weaknesses of organization (advantages and disadvantages), as well as opportunities and threats of external environment. The results of SWOT analysis are the basis for optimization the business processes, for development by the leading specialists in organization of interrelated complex of strategies and competitive activities. ConceptDraw DIAGRAM software enhanced with SWOT and TOWS Matrix Diagrams Solution will effectively help you in strategic planning for your company, department, project, in development marketing campaign, in identification of four categories of factors of internal and external environment of organization, and construction professional-looking SWOT and TOWS matrices.Gantt Chart Software
The Gantt Chart is the main interface in ConceptDraw PROJECT. It summarizes the tasks in your project and presents them graphically so you can easily view your progress.- Garrett IA Diagrams with ConceptDraw PRO | Garretts Diagram Is ...
- Garrett IA Diagrams with ConceptDraw PRO | Event-driven Process ...
- Garrett IA Diagrams with ConceptDraw PRO | Garrets Diagram Are ...
- Basic Flowchart Symbols and Meaning | Garrett IA Diagrams with ...
- Garrett IA Diagrams with ConceptDraw PRO | Simple Diagramming ...
- How to Create Multipage Diagram | Garrett IA Diagrams with ...
- Garrett IA Diagrams with ConceptDraw PRO | Basic Flowchart ...
- Human Resource Development | Garrett IA Diagrams with ...
- Web Diagram Creator
- Process Flowchart | Garrett IA Diagrams with ConceptDraw PRO ...
- A Line In The Flow Chart Is Used To Connect Between Elements
- Explain Time Scale Diagram In Pert
- Types of Flowchart - Overview | IDEF3 Standard | Garrett IA ...
- Gane Sarson Diagram | DFD Flowchart Symbols | Garrett IA ...
- How to Create a Social Media DFD Flowchart | Garrett IA Diagrams ...
- Diagram Of Idea On Internet
- Garrett IA Diagrams with ConceptDraw PRO | IDEF3 Standard ...
- Data Flow Diagram Symbols. DFD Library | Types of Flowchart ...
- Basic Flowchart Symbols and Meaning | Website traffic dashboard ...
- Diagram Of Idea Of Internet


