This process flow diagram (PFD) example shows an amine treating system for the removal of gaseous hydrogen sulfide from gas streams. It is used in oil refineries and chemical plants. This PFD sample was redesigned from the Wikimedia Commons file: AmineTreating.png. [commons.wikimedia.org/ wiki/ File:AmineTreating.png]
This file is licensed under the Creative Commons Attribution-Share Alike 3.0 Unported license. [creativecommons.org/ licenses/ by-sa/ 3.0/ deed.en]
"Amine gas treating, also known as gas sweetening and acid gas removal, refers to a group of processes that use aqueous solutions of various alkylamines (commonly referred to simply as amines) to remove hydrogen sulfide (H2S) and carbon dioxide (CO2) from gases. It is a common unit process used in refineries, and is also used in petrochemical plants, natural gas processing plants and other industries.
Processes within oil refineries or chemical processing plants that remove hydrogen sulfide are referred to as "sweetening" processes because the odor of the processed products is improved by the absence of hydrogen sulfide. An alternative to the use of amines involves membrane technology. Membranes are attractive since no reagents are consumed.
Many different amines are used in gas treating:
Diethanolamine (DEA),
Monoethanolamine (MEA),
Methyldiethanolamine (MDEA),
Diisopropanolamine (DIPA),
Aminoethoxyethanol (Diglycolamine) (DGA).
The most commonly used amines in industrial plants are the alkanolamines DEA, MEA, and MDEA. These amines are also used in many oil refineries to remove sour gases from liquid hydrocarbons such as liquified petroleum gas (LPG)." [Amine gas treating. Wikipedia]
The PFD example "Amine treating unit schematic diagram" was drawn using the ConceptDraw PRO diagramming and vector drawing software extended with the Chemical and Process Engineering solution from the Chemical and Process Engineering area of ConceptDraw Solution Park.
Process Flow Diagram (PFD)
-amine-treating-unit-schematic-diagram.png--diagram-flowchart-example.png)
Process Flow Diagram

Process Flow Diagram Symbols

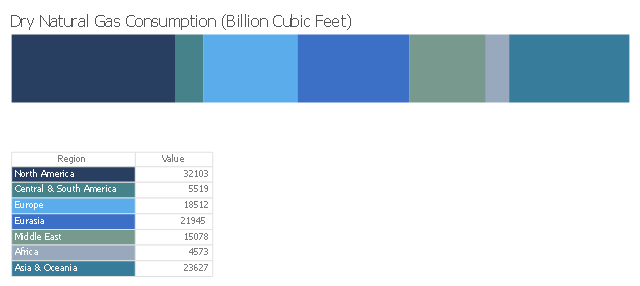
This divided bar diagram sample shows the global natural gas consumption by regions in 2013. It was designed using data of the International Energy Statistics webpage from the U.S. Energy Information Administration (EIA) website. [eia.gov/ cfapps/ ipdbproject/ IEDIndex3.cfm?tid=3&pid=26&aid=2]
"Natural gas is a fossil fuel formed when layers of buried plants and animals are exposed to intense heat and pressure over thousands of years. The energy that the plants originally obtained from the sun is stored in the form of chemical bonds in natural gas. Natural gas is a nonrenewable resource because it cannot be replenished on a human time frame. Natural gas is a hydrocarbon gas mixture consisting primarily of methane, but commonly includes varying amounts of other higher alkanes and even a lesser percentage of carbon dioxide, nitrogen, and hydrogen sulfide. Natural gas is an energy source often used for heating, cooking, and electricity generation. It is also used as fuel for vehicles and as a chemical feedstock in the manufacture of plastics and other commercially important organic chemicals." [Natural gas. Wikipedia]
The chart example "Global natural gas consumption" was created using ConceptDraw PRO diagramming and vector drawing software extended with the Divided Bar Diagrams solution from the Graphs and Charts area of ConceptDraw Solution Park.
Divided bar chart
This PFD sample was redesigned from the Wikipedia file: NaturalGasCondensate.png.
"This is a schematic flow diagram of a typical facility for separating and recovering liquid condensate from raw natural gas."
[en.wikipedia.org/ wiki/ File:NaturalGasCondensate.png]
"Natural-gas condensate is a low-density mixture of hydrocarbon liquids that are present as gaseous components in the raw natural gas produced from many natural gas fields. It condenses out of the raw gas if the temperature is reduced to below the hydrocarbon dew point temperature of the raw gas.
The natural gas condensate is also referred to as simply condensate, or gas condensate, or sometimes natural gasoline because it contains hydrocarbons within the gasoline boiling range. Raw natural gas may come from any one of three types of gas wells:
(1) Crude oil wells - Raw natural gas that comes from crude oil wells is called associated gas. This gas can exist separate from the crude oil in the underground formation, or dissolved in the crude oil.
(2) Dry gas wells - These wells typically produce only raw natural gas that does not contain any hydrocarbon liquids. Such gas is called non-associated gas.
(3) Condensate wells - These wells produce raw natural gas along with natural gas liquid. Such gas is also non-associated gas and often referred to as wet gas." [Natural-gas condensate. Wikipedia]
The process flow diagram example "Natural gas condensate - PFD" was drawn using the ConceptDraw PRO software extended with the Chemical and Process Engineering solution from the Chemical and Process Engineering area of ConceptDraw Solution Park.
Process flow diagram (PFD)
-natural-gas-condensate---pfd.png--diagram-flowchart-example.png)
This PFD of jet fuel mercaptan oxidation treating was redrawn from Wikipedia file: ConvLPGMerox.png. [en.wikipedia.org/ wiki/ File:ConvKeroMerox.png]
This file is licensed under the Creative Commons Attribution-Share Alike 3.0 Unported icense. [creativecommons.org/ licenses/ by-sa/ 3.0/ deed.en]
"Merox is an acronym for mercaptan oxidation. It is a proprietary catalytic chemical process developed by UOP used in oil refineries and natural gas processing plants to remove mercaptans from LPG, propane, butanes, light naphthas, kerosene and jet fuel by converting them to liquid hydrocarbon disulfides.
The Merox process requires an alkaline environment which, in some of the process versions, is provided by an aqueous solution of sodium hydroxide (NaOH), a strong base, commonly referred to as caustic. In other versions of the process, the alkalinity is provided by ammonia, which is a weak base.
The catalyst in some versions of the process is a water-soluble liquid. In other versions, the catalyst is impregnated onto charcoal granules.
Processes within oil refineries or natural gas processing plants that remove mercaptans and/ or hydrogen sulfide (H2S) are commonly referred to as sweetening processes because they results in products which no longer have the sour, foul odors of mercaptans and hydrogen sulfide. The liquid hydrocarbon disulfides may remain in the sweetened products, they may be used as part of the refinery or natural gas processing plant fuel, or they may be processed further.
The Merox process is usually more economical than using a catalytic hydrodesulfurization process for much the same purpose." [en.wikipedia.org/ wiki/ Merox]
The process flow diagram (PFD) example "Jet fuel mercaptan oxidation treating" was drawn using the ConceptDraw PRO software extended with the Chemical and Process Engineering solution from the Chemical and Process Engineering area of ConceptDraw Solution Park.
Process flow diagram (PFD)
-jet-fuel-mercaptan-oxidation-treating---pfd.png--diagram-flowchart-example.png)
Process Flow Chart

Piping and Instrumentation Diagram Software

 Chemical and Process Engineering
This chemical engineering solution extends ConceptDraw DIAGRAM.9.5 (or later) with process flow diagram symbols, samples, process diagrams templates and libraries of design elements for creating process and instrumentation diagrams, block flow diagrams (BFD
Business and Software Diagrams
- Oil Gas Plant Diagram
- Oil And Gas Plant Electrical Drawing Diagram
- Diagram Of A Plant
- Oil And Gas Process Flow Diagram
- Gas Plant Process Flow Diagram
- Natural Gas Processing Plant Diagram
- Gas Processing Plant Flow Diagram
- Electrical Circuit Diagram For Oil And Gas Plant
- Schematic Flow Chart Diagram Of Natural Gas Processing Plants