Mechanical Drawing Symbols
Mechanical Drawings are the special type of technical diagrams that visualize the structure of complex systems and illustrate the information about ventilation, heating, air conditioning, i.e. HVAC systems. These drawings are created on the base of floor plans and reflected ceiling plans, and then become an obligatory part of construction project which is needed directly for construction a building and for receiving a permit on it. Mechanical drawings and diagrams help effectively represent construction, technical and engineering solutions, and also schematics of different mechanical equipment. ConceptDraw DIAGRAM ector drawing software enhanced with Mechanical Engineering solution from Engineering area of ConceptDraw Solution Park provides wide set of effective drawing tools, predesigned mechanical drawing symbols, templates, samples and examples. Use of standardized and recognized mechanical vector symbols helps you design understandable mechanical drawings, diagrams and mechanical engineering schematics.Sales Teams are Inherently Competitive
Sales teams are inherently competitive, so you don't need to invent extra ways to stimulate the competition. At the same time, you can provide the team with a sales dashboard shows company, team and personal KPI to make the competition clear.Business Graphics Software
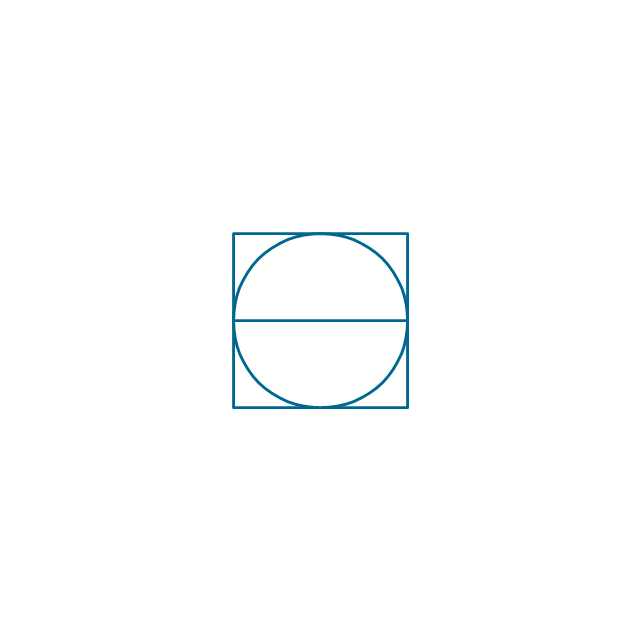
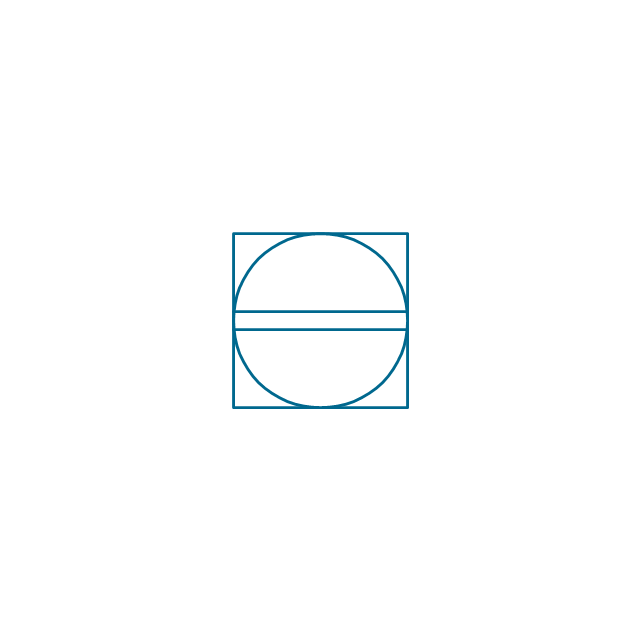
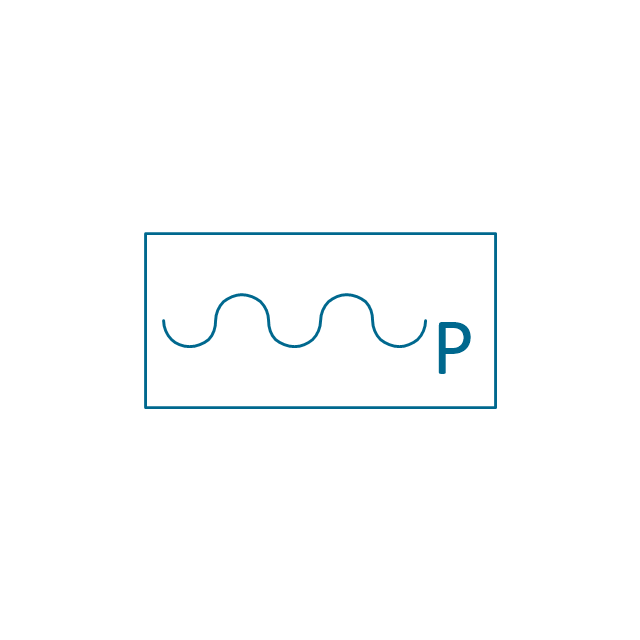
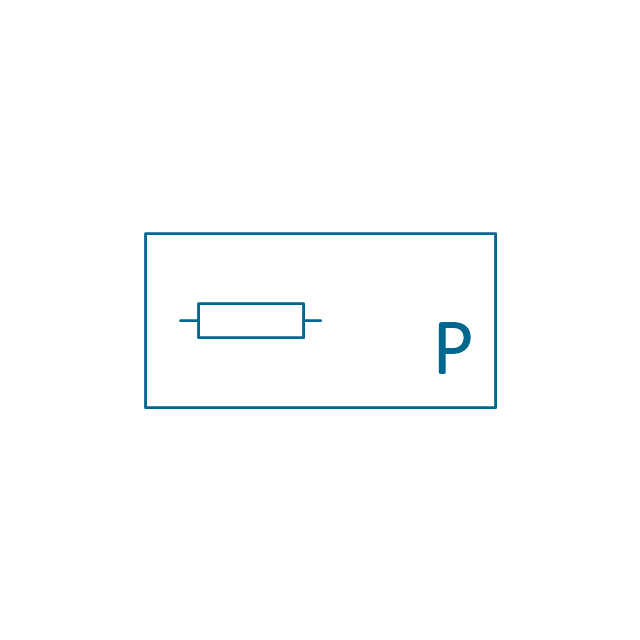
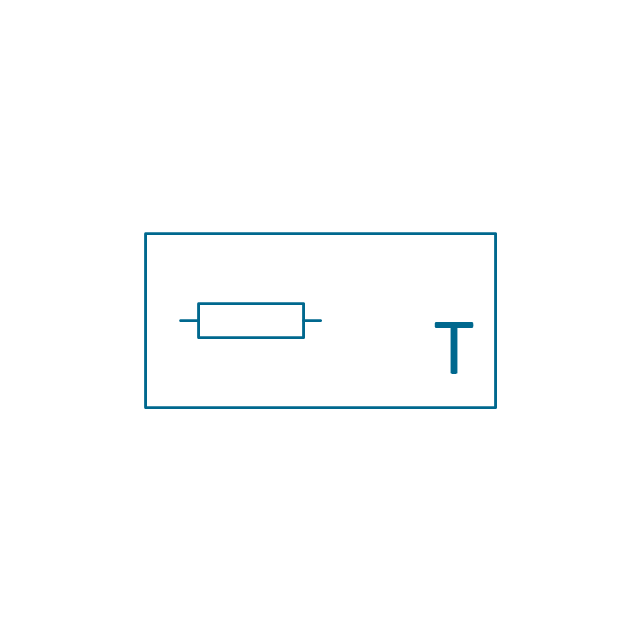
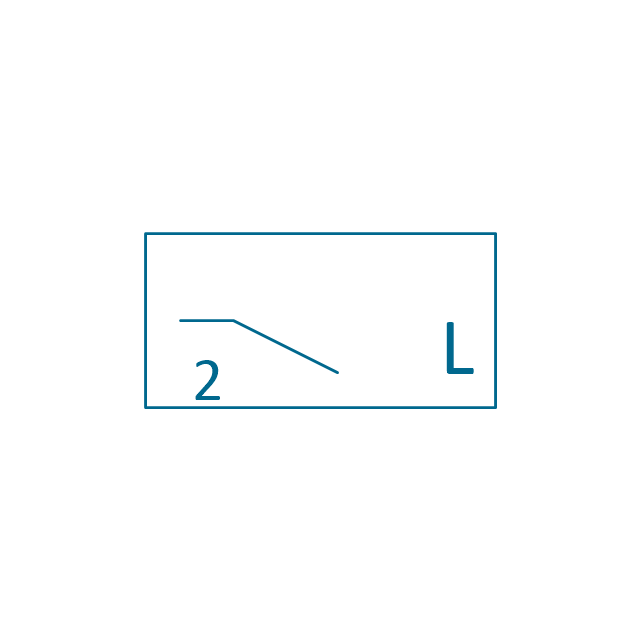
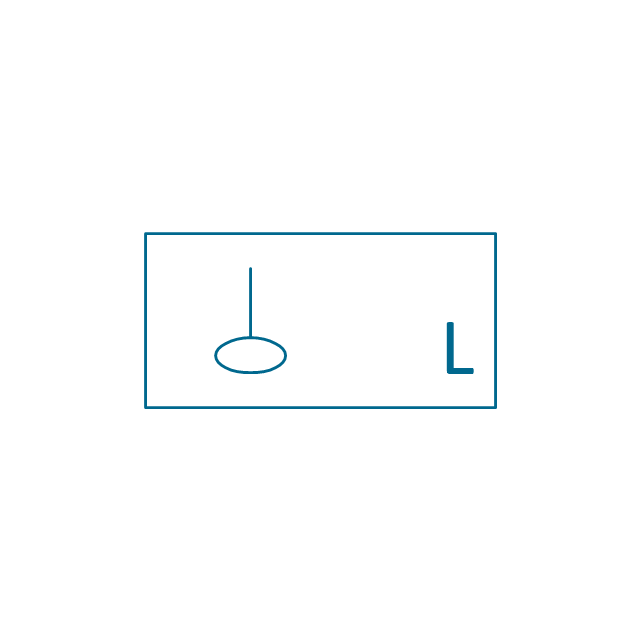
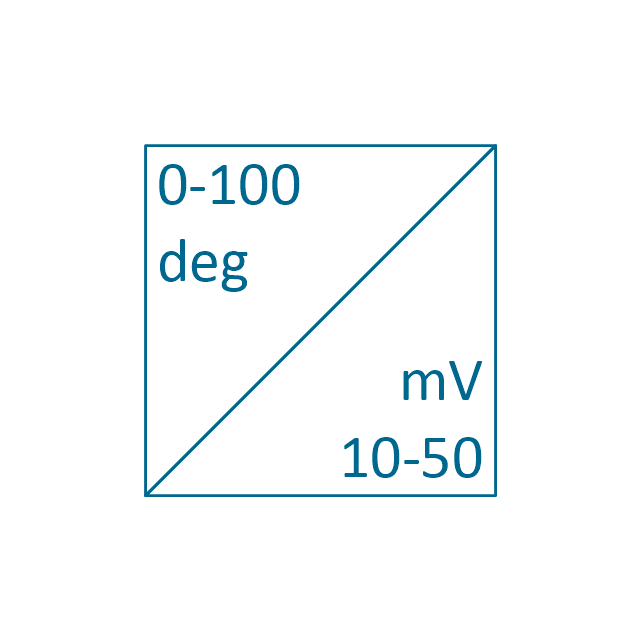
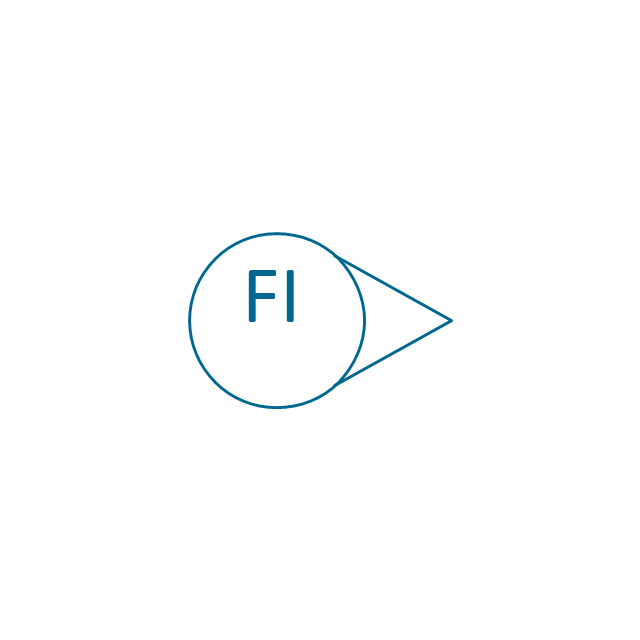
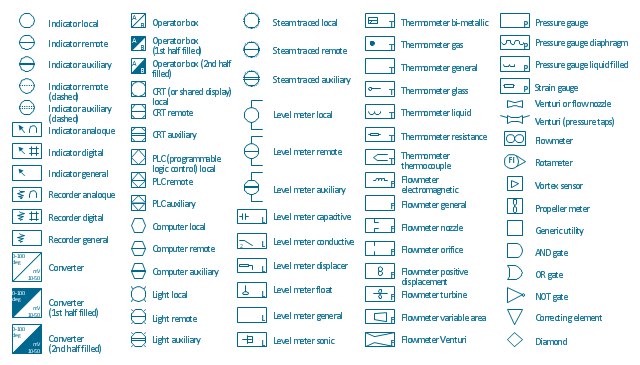
ConceptDraw DIAGRAM is a business graphics software that allows you improve your business using Sales Performance Dashboard helps you analyze your data more efficiently.The vector stencils library "Instruments" contains 72 symbols of control instruments and measuring devices: meters and gauges, and callouts, text boxes, and inserts.
Use these shapes to create annotated process flow diagrams (PFD), flow control, manufacturing processes, and distribution system diagrams in the ConceptDraw PRO software extended with the Chemical and Process Engineering solution from the Chemical and Process Engineering area of ConceptDraw Solution Park.
www.conceptdraw.com/ solution-park/ engineering-chemical-process
KPI Dashboard
ConceptDraw DIAGRAM diagramming and vector drawing software supplied with Sales Dashboard solution from the Marketing area of ConceptDraw Solution Park provides the full set of useful tools which make it the best for producing the live KPI Dashboard of any complexity.The vector stencils library "Instruments" contains 72 symbols of control instruments and measuring devices: meters and gauges, and callouts, text boxes, and inserts.
Use these shapes to create annotated process flow diagrams (PFD), flow control, manufacturing processes, and distribution system diagrams.
"Process control is an engineering discipline that deals with architectures, mechanisms and algorithms for maintaining the output of a specific process within a desired range.
Process control is extensively used in industry and enables mass production of continuous processes such as oil refining, paper manufacturing, chemicals, power plants and many other industries. Process control enables automation, with which a small staff of operating personnel can operate a complex process from a central control room." [Process control. Wikipedia]
The example "Design elements - Instruments" was created using the ConceptDraw PRO diagramming and vector drawing software extended with the Chemical and Process Engineering solution from the Engineering area of ConceptDraw Solution Park.
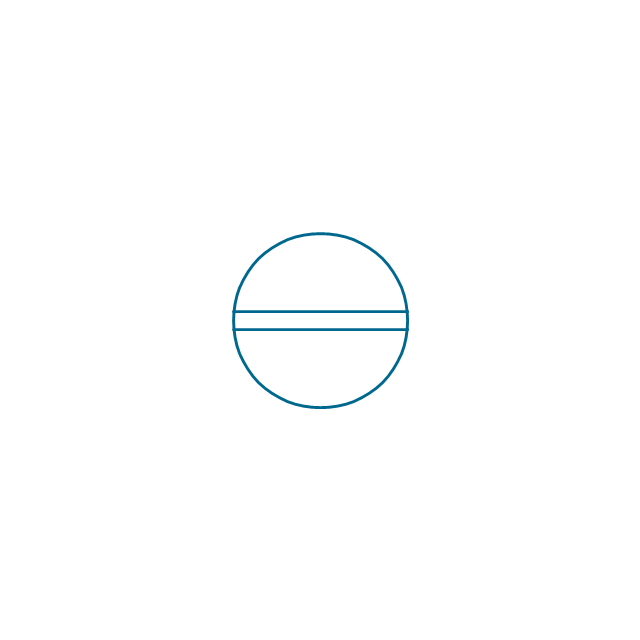
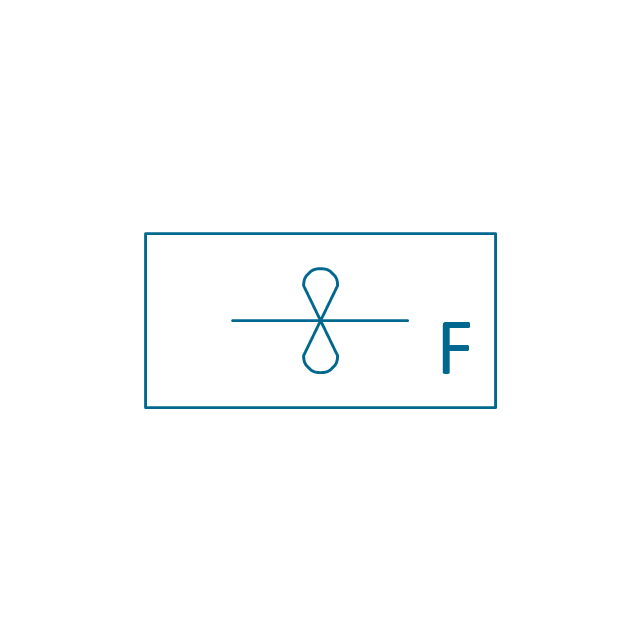
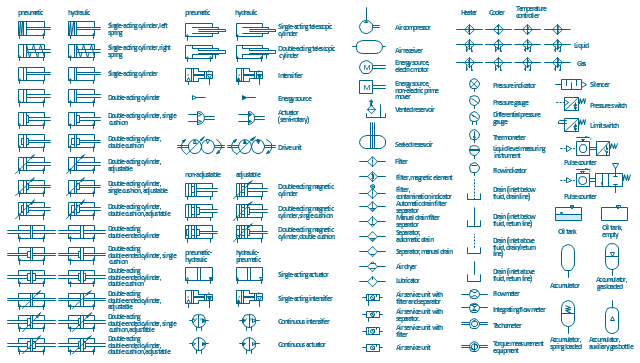
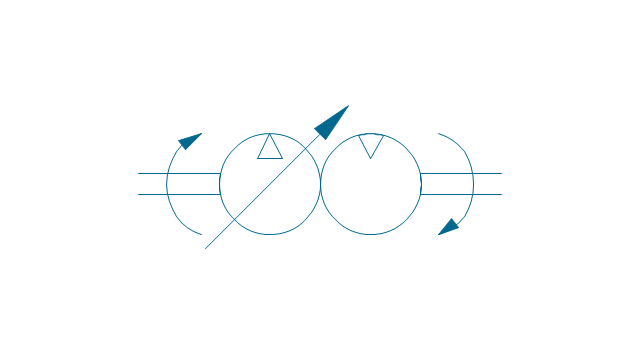
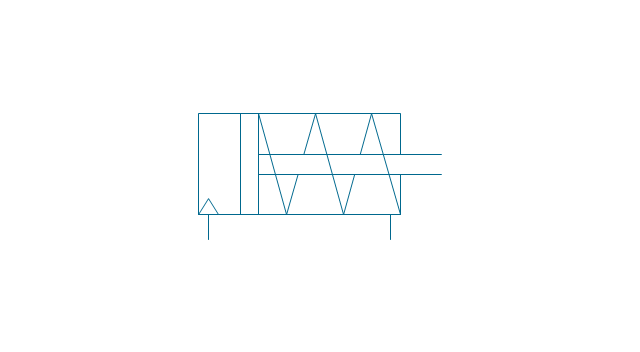
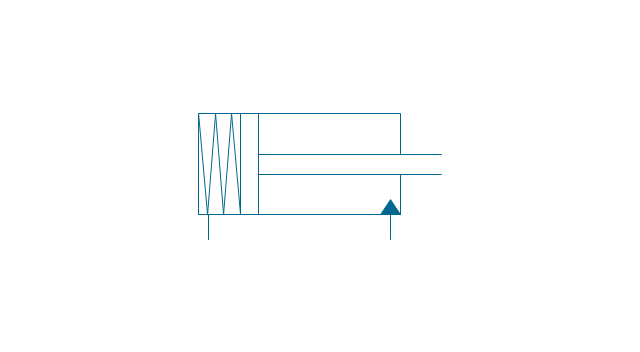
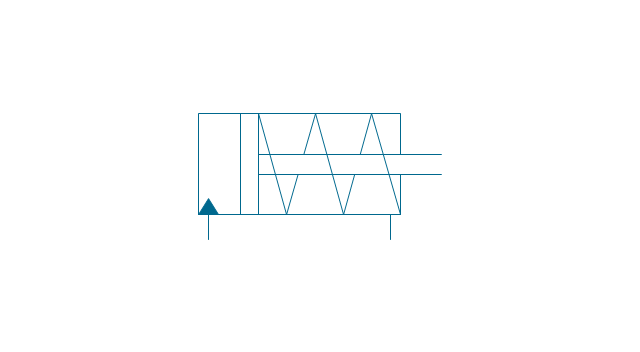
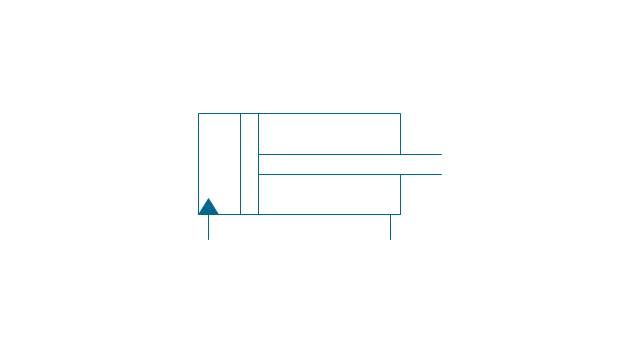
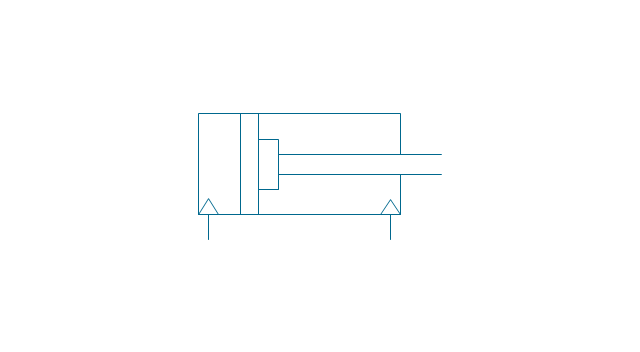
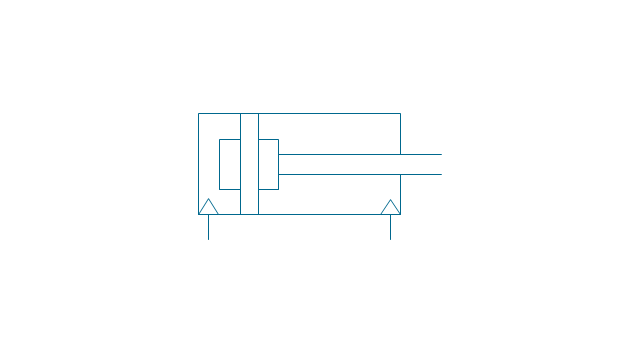
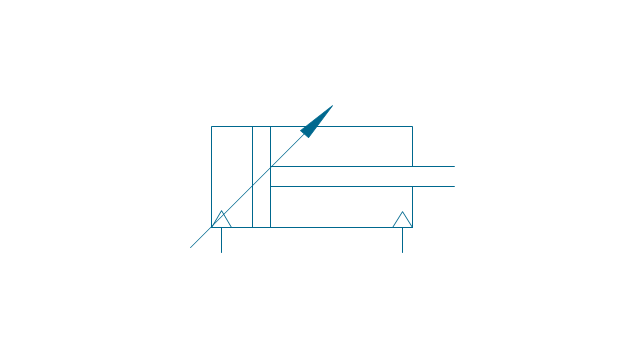
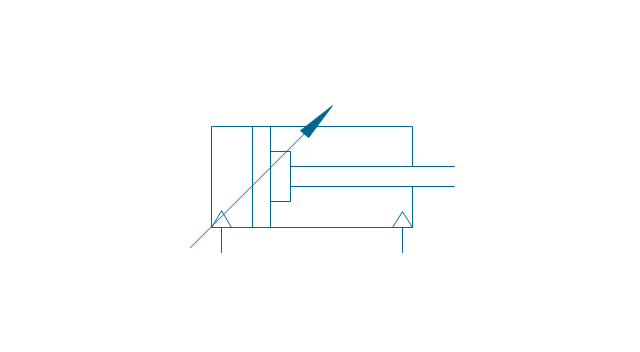
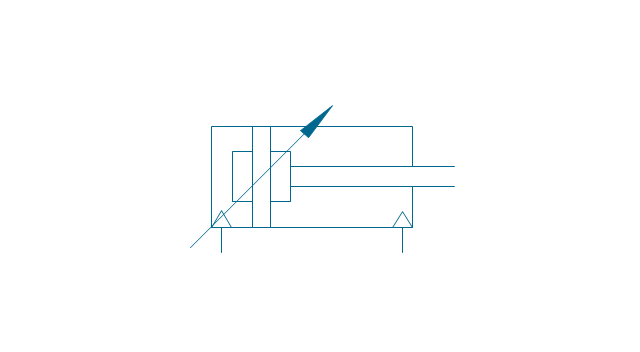
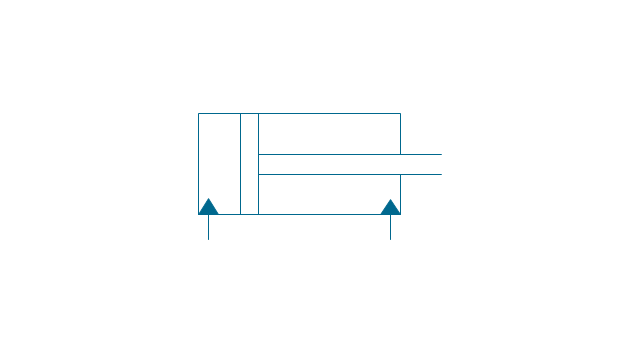
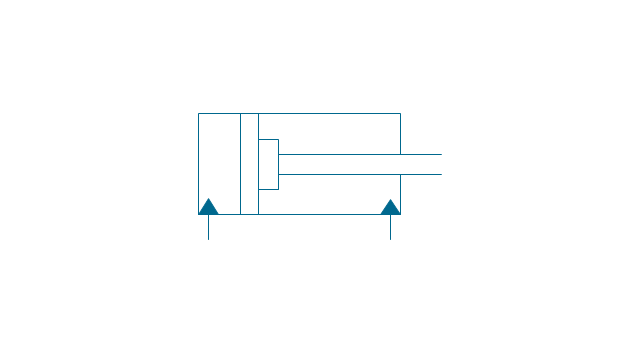
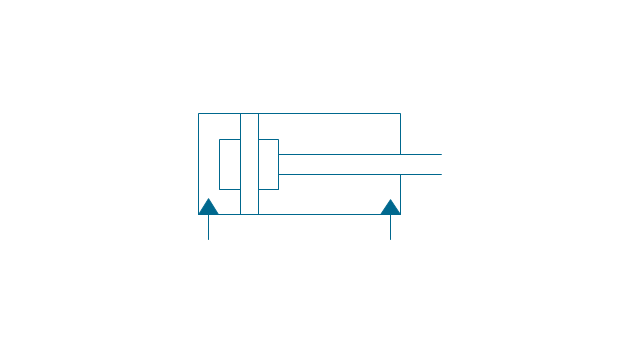
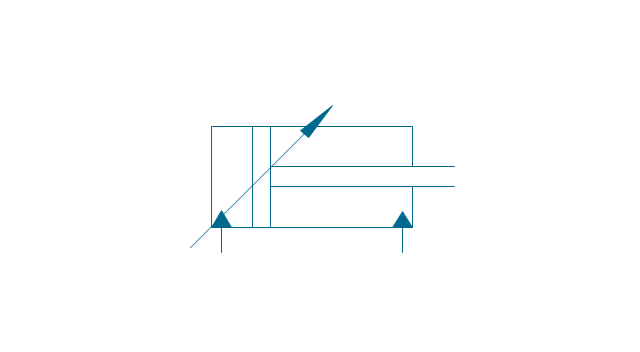
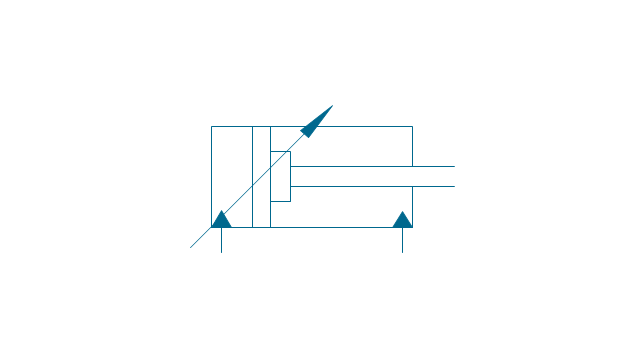
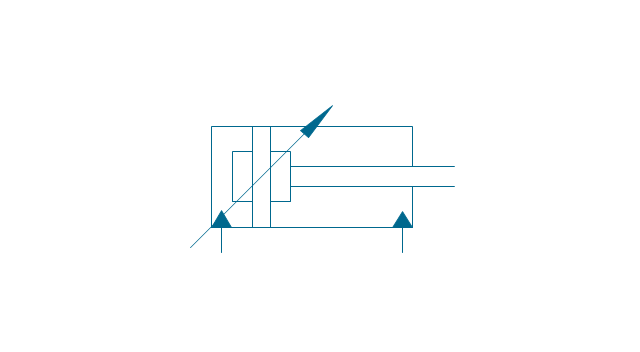
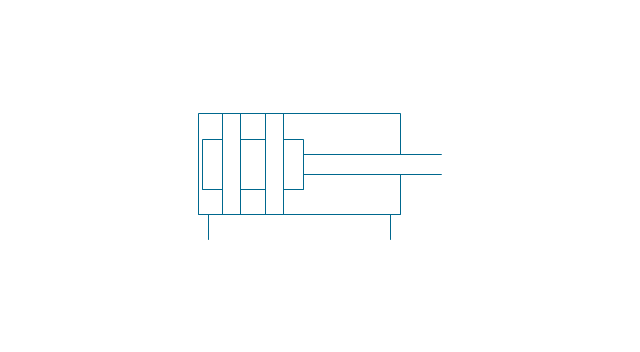
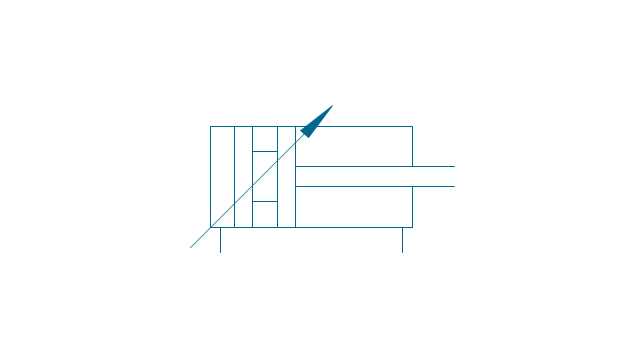
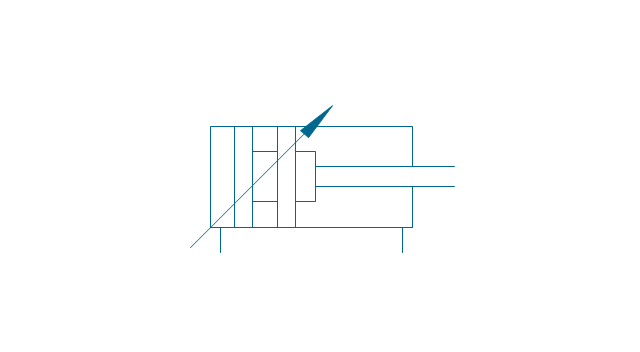
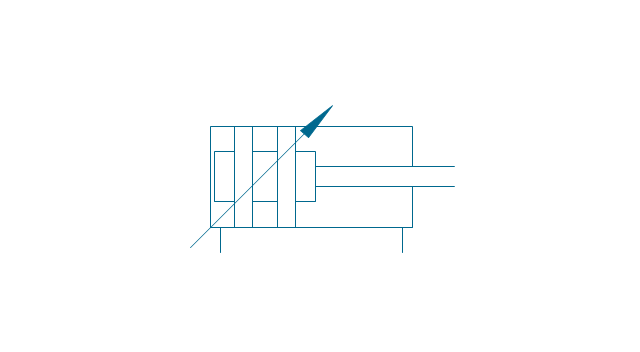
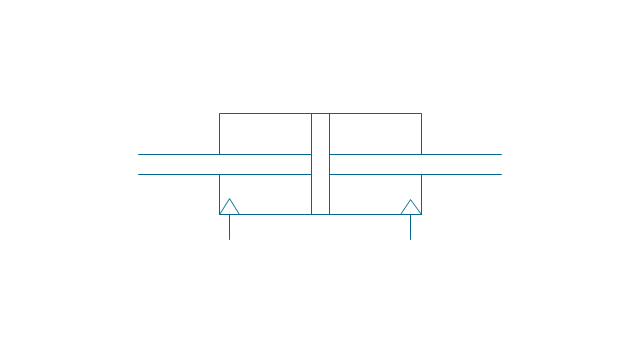
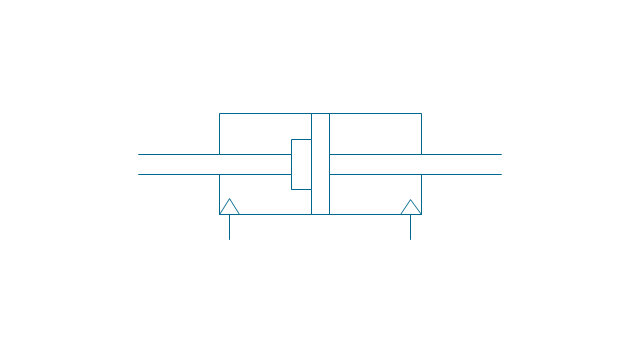
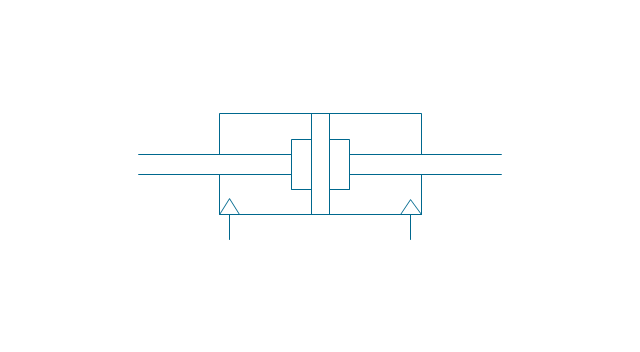
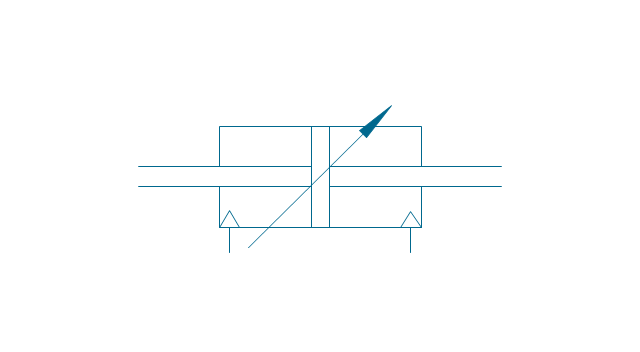
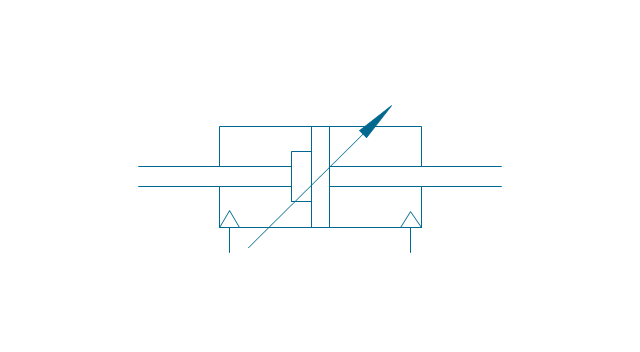
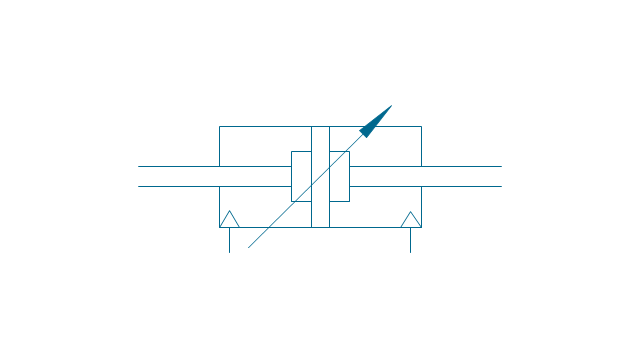
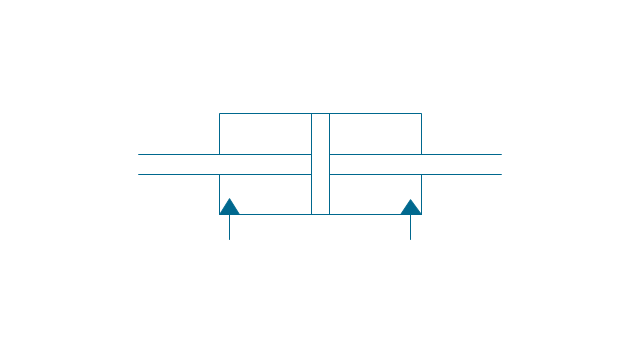
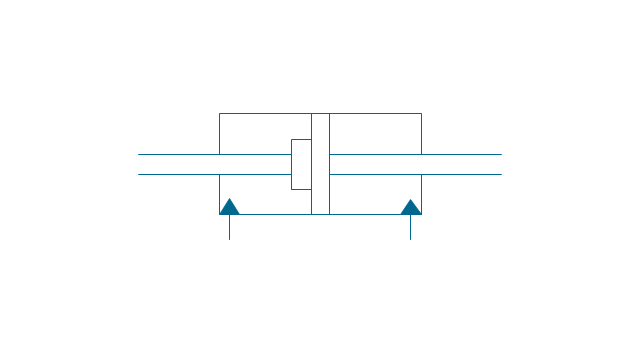
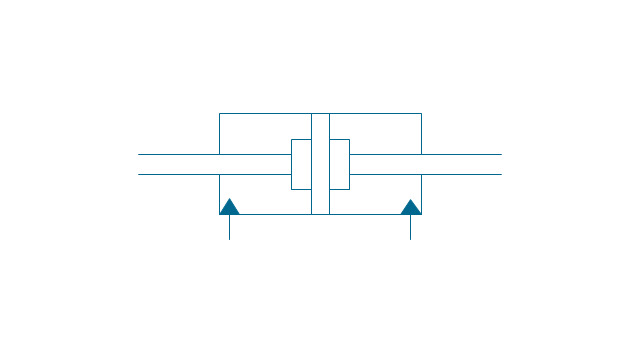
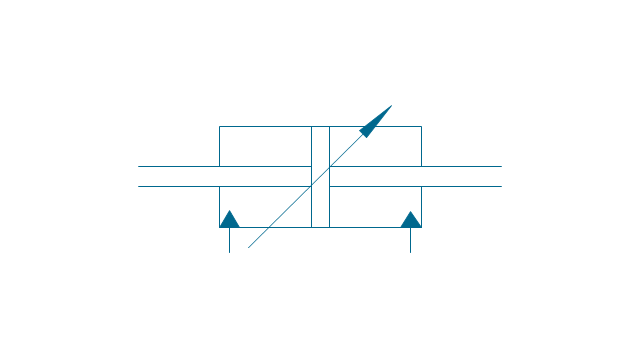
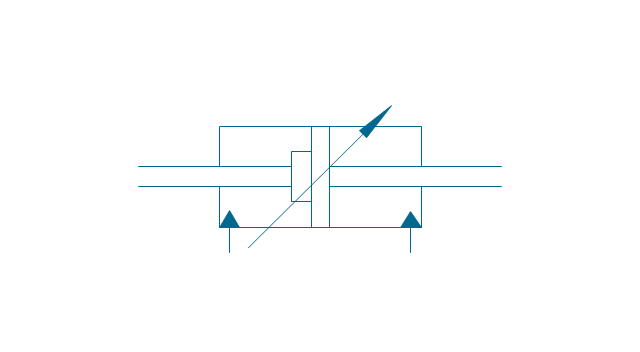
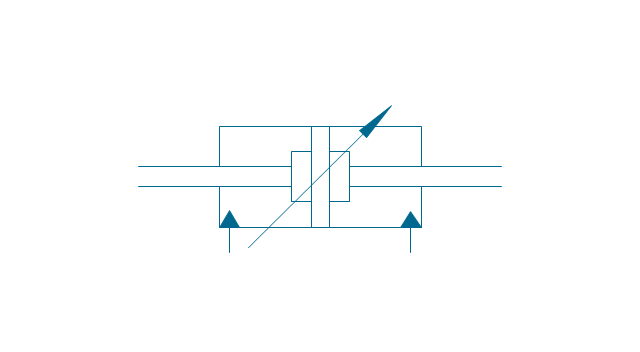
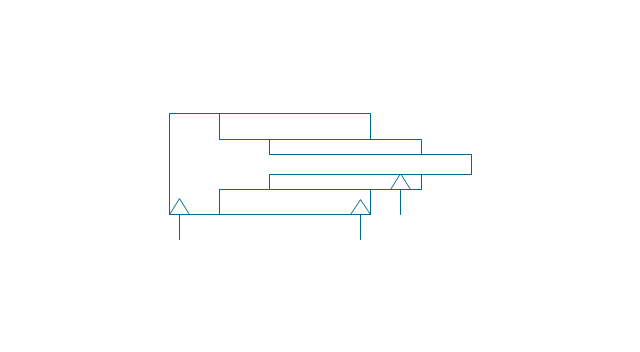
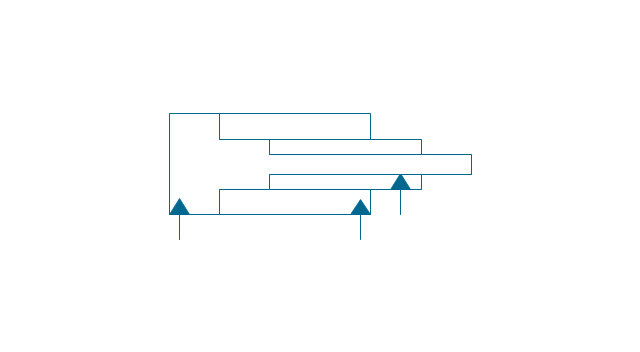
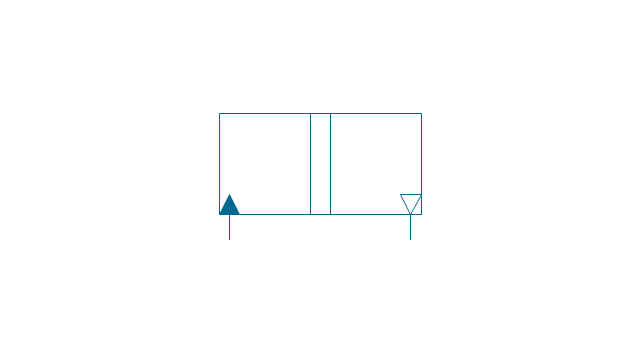
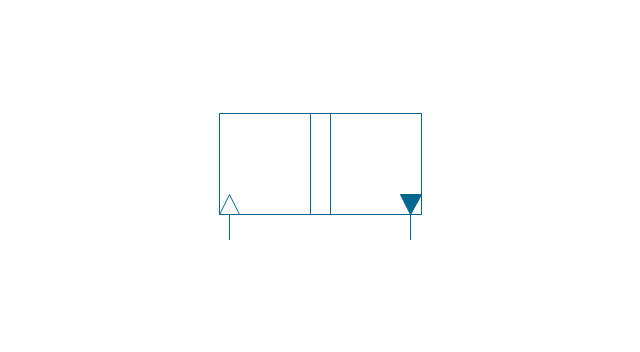
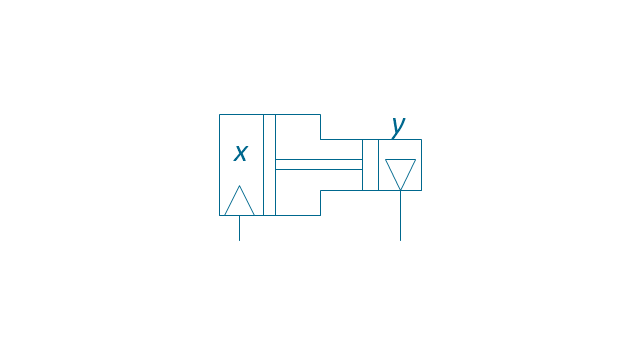
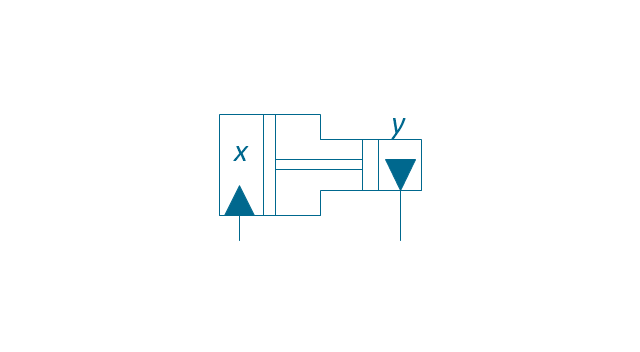
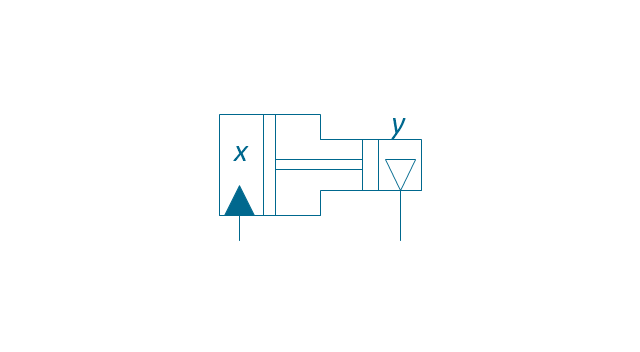
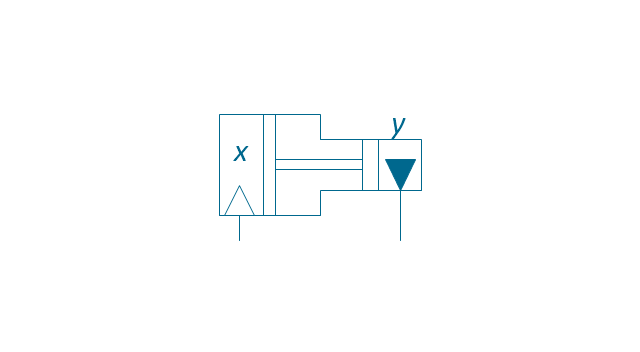
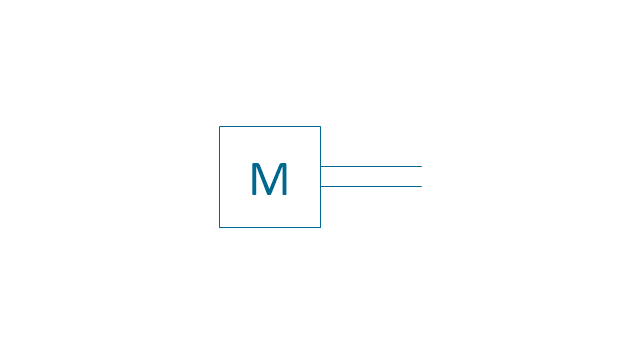
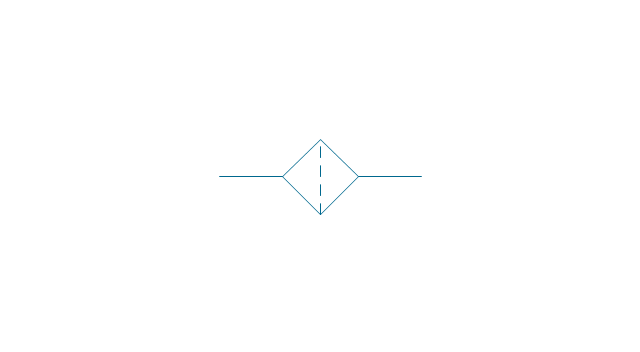
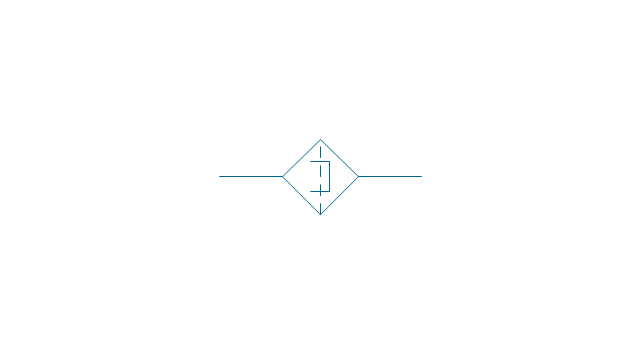
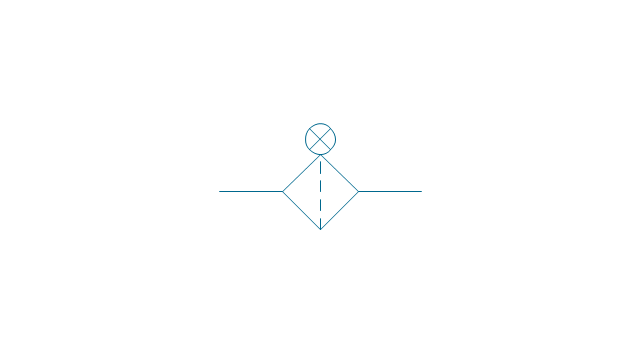
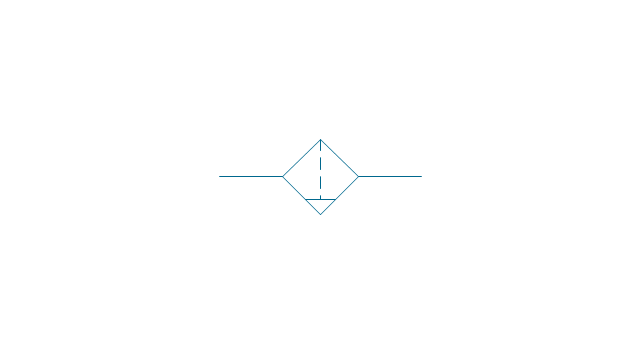
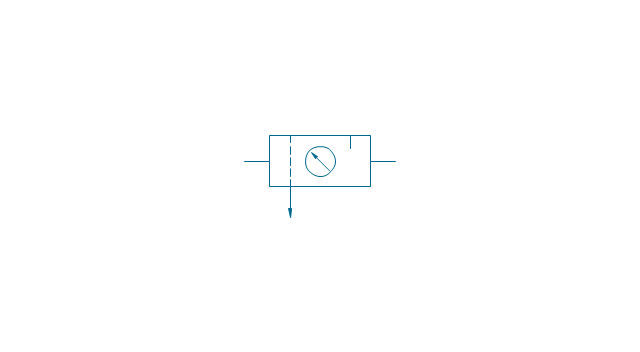
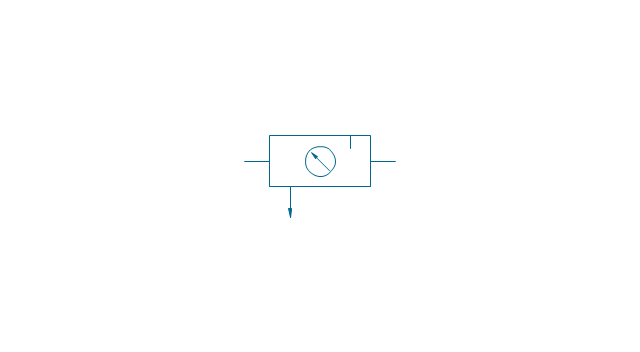
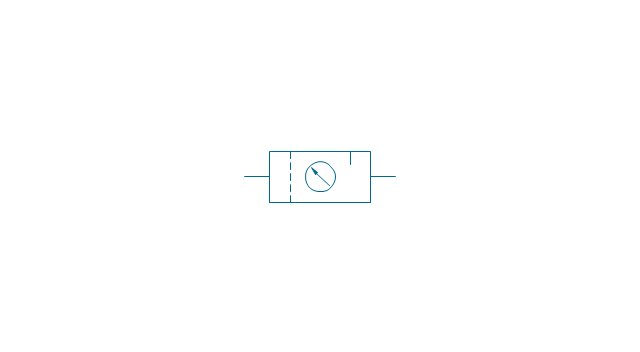
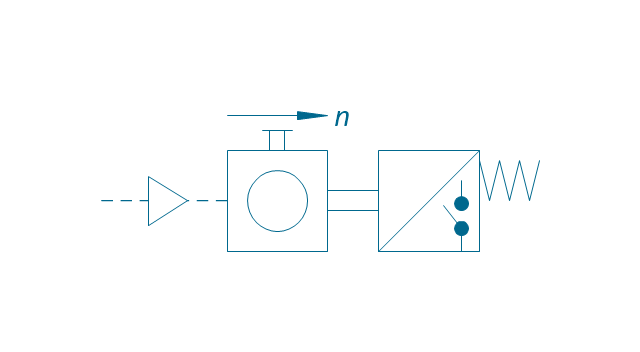
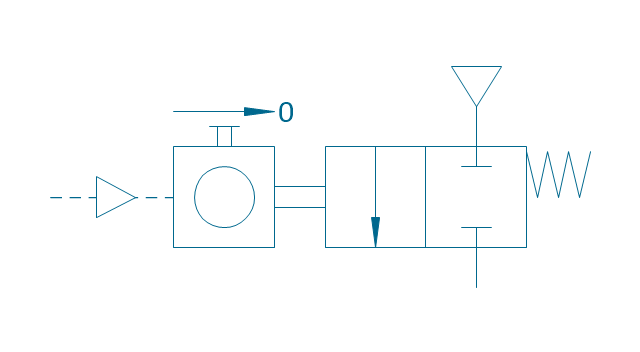
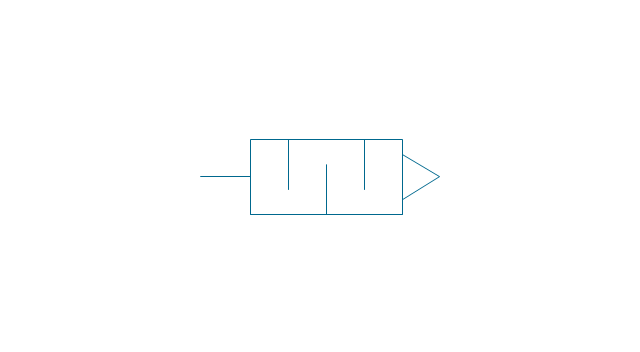
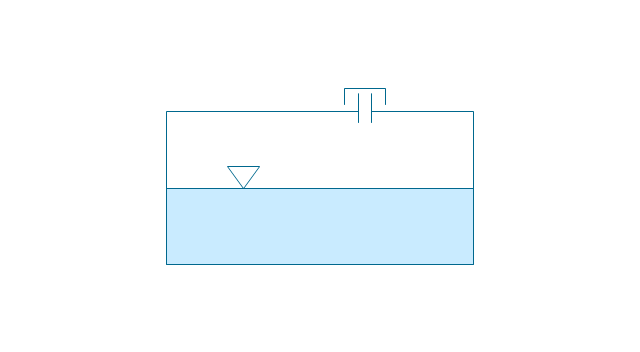
The vector stencils library "Fluid power equipment" contains 113 symbols of hydraulic and pneumatic equipment including pumps, motors, air compressors, cylinders, meters, gauges, and actuators. Use it to design fluid power and hydraulic control systems.
"Fluid power is the use of fluids under pressure to generate, control, and transmit power. Fluid power is subdivided into hydraulics using a liquid such as mineral oil or water, and pneumatics using a gas such as air or other gases. Compressed-air and water-pressure systems were once used to transmit power from a central source to industrial users over extended geographic areas; fluid power systems today are usually within a single building or mobile machine." [Fluid power. Wikipedia]
The shapes example "Design elements - Fluid power equipment" was created using the ConceptDraw PRO diagramming and vector drawing software extended with the Mechanical Engineering solution from the Engineering area of ConceptDraw Solution Park.
The vector stencils library "Fluid power equipment" contains 113 symbols of hydraulic and pneumatic equipment including pumps, motors, air compressors, cylinders, meters, gauges, and actuators.
Use it to design fluid power and hydraulic control systems in the ConceptDraw PRO diagramming and vector drawing software extended with the Mechanical Engineering solution from the Engineering area of ConceptDraw Solution Park.
www.conceptdraw.com/ solution-park/ engineering-mechanical
Use it to design fluid power and hydraulic control systems in the ConceptDraw PRO diagramming and vector drawing software extended with the Mechanical Engineering solution from the Engineering area of ConceptDraw Solution Park.
www.conceptdraw.com/ solution-park/ engineering-mechanical
HelpDesk
How to Create a Meter Dashboard
The Time Series Dashboard Solution can be used to create the interactive Time Series Charts as Column Charts, Line Charts, or Bar Charts for your interactive dashboard.The Best Drawing Program for Mac
ConceptDraw DIAGRAM is the professional business graphic software for drawing diagrams and charts with great visual appeal on Mac OS X.This vector stencils library contains 195 cloud computing icons.
Use it to design cloud computing infographic and diagrams with ConceptDraw PRO software.
"Cloud computing, also on-demand computing, is a kind of Internet-based computing that provides shared processing resources and data to computers and other devices on demand. It is a model for enabling ubiquitous, on-demand access to a shared pool of configurable computing resources (e.g., networks, servers, storage, applications and services), which can be rapidly provisioned and released with minimal management effort. Cloud computing and storage solutions provide users and enterprises with various capabilities to store and process their data in third-party data centers.
Cloud computing has become a highly demanded service or utility due to the advantages of high computing power, cheap cost of services, high performance, scalability, accessibility as well as availability." [Cloud computing. Wikipedia]
The vector stencils library "Cloud clipart" is included in the Cloud Computing Diagrams solution from the Computer and Networks area of ConceptDraw Solution Park.
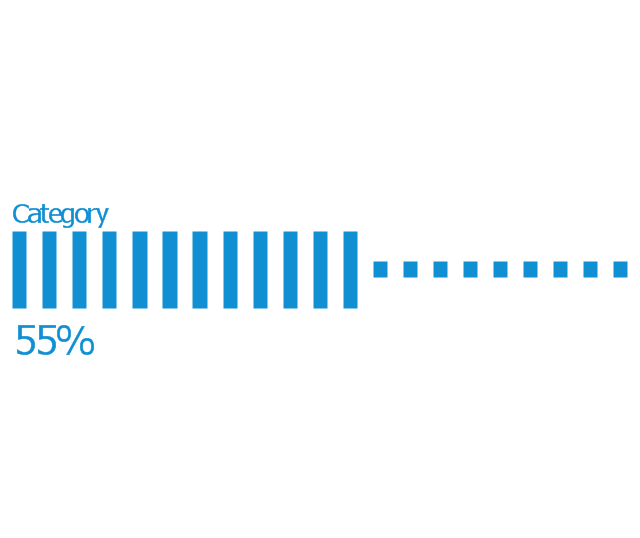
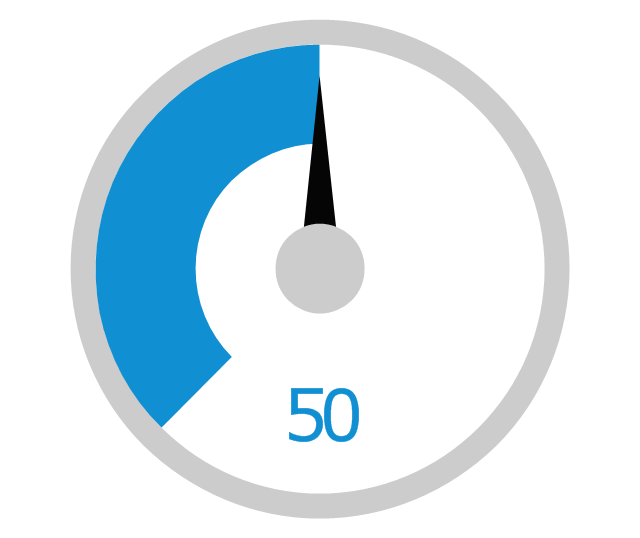
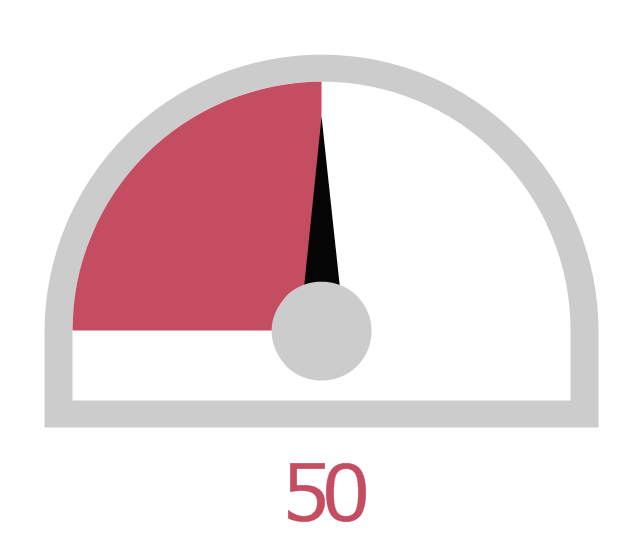
The vector stencils library "Management indicators" contains 14 visual indicators.
Use it to create your management infogram in the ConceptDraw PRO diagramming and vector drawing software.
The example "Management indicators - Vector stencils library" is included in the solution "Marketing infographics" from the "Business infographics" area of ConceptDraw Solution Park.
Use it to create your management infogram in the ConceptDraw PRO diagramming and vector drawing software.
The example "Management indicators - Vector stencils library" is included in the solution "Marketing infographics" from the "Business infographics" area of ConceptDraw Solution Park.
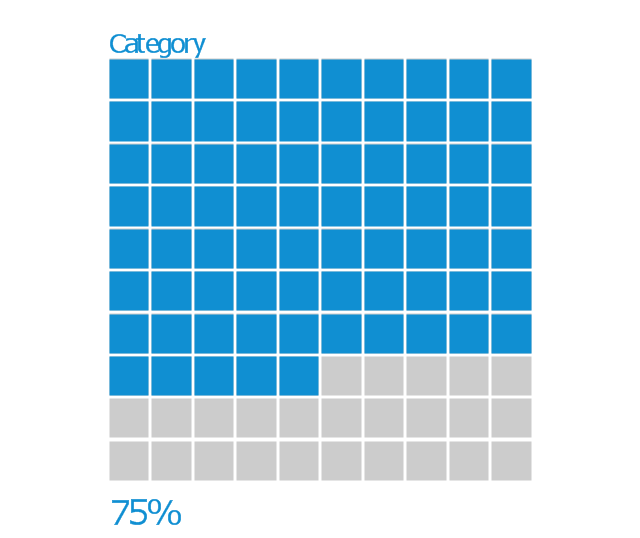
The vector stencils library "Education indicators" contains 12 graphic indicators.
Use these visual indicators to design your educational infogram.
The vector stencils library "Education indicators" is included in the Education Infographics solution from the Business Infographics area of ConceptDraw Solution Park.
Use these visual indicators to design your educational infogram.
The vector stencils library "Education indicators" is included in the Education Infographics solution from the Business Infographics area of ConceptDraw Solution Park.
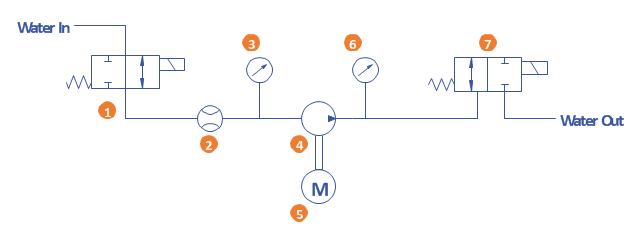
A simple hydraulic schematic showing apparatus for testing the strength of a hydraulic hose splice.
Water enters through normally closed solenoid valve (1) and passes through intake flow meter (2) to high pressure pump (4). Intake water pressure is monitored by pressure gauge (3). The hose to be tested connects between pump (4) and normally open solenoid activated drain valve (7). To test the hose, pump drive motor (5) is turned on, the solenoid of drain valve (7) is activated, closing the valve, and the pump is run to pressurize the hose. Test pressure is monitored by gauge (6). When the test is complete or the hose fails, the solenoid of drain valve (7) is deactivated, opening valve and discharging water, depressurizing the system. All components are operated electrically by a remote control circuit so that the operator may perform the test from a protected location, monitoring it with a camera and video monitor.
This hydraulic schematic example was redrawn using ConceptDraw PRO diagramming and vector drawing software from the Wikimedia Commons file: Hydraulic schematic.jpg.
[commons.wikimedia.org/ wiki/ File:Hydraulic_ schematic.jpg]
This file is licensed under the Creative Commons Attribution-Share Alike 3.0 Unported license.
[creativecommons.org/ licenses/ by-sa/ 3.0/ deed.en]
The hydraulic schematic example "Apparatus for testing the strength of a hydraulic hose splice" is included in the Mechanical Engineering solution from the Engineering area of ConceptDraw Solution Park.
This vector stencils library contains 195 cloud computing icons.
Use it to design cloud computing infographic and diagrams with ConceptDraw PRO software.
"Cloud computing, also on-demand computing, is a kind of Internet-based computing that provides shared processing resources and data to computers and other devices on demand. It is a model for enabling ubiquitous, on-demand access to a shared pool of configurable computing resources (e.g., networks, servers, storage, applications and services), which can be rapidly provisioned and released with minimal management effort. Cloud computing and storage solutions provide users and enterprises with various capabilities to store and process their data in third-party data centers.
Cloud computing has become a highly demanded service or utility due to the advantages of high computing power, cheap cost of services, high performance, scalability, accessibility as well as availability." [Cloud computing. Wikipedia]
The vector stencils library "Cloud clipart" is included in the Cloud Computing Diagrams solution from the Computer and Networks area of ConceptDraw Solution Park.
- Strain Gauge Electrical Symbol
- Mechanical Drawing Symbols | Meter Dashboard | Sales Teams are ...
- Mechanical Drawing Symbols | Meter Dashboard | Customer ...
- Meter Gauge Symbol
- Mechanical Drawing Symbols | Symbol Pressure Gauge Piping
- Vacuum Gauge Symbol
- Project tasks dashboard | Design elements - Meter indicators ...
- Symbols Of Strain Gauges
- Instruments - Vector stencils library | Mechanical Drawing Symbols ...
- Hydraulic Operation Symbols Gauge
- Different Symbols In Steam Distribution Line
- Symbol Of Venturi Meter
- Electrical Symbols — Thermo | Electrical Symbols — Resistors ...
- Mechanical Drawing Symbols | How to Connect Tabular Data (CSV ...
- Mechanical Drawing Symbols | Design elements - Fluid power ...
- Instruments - Vector stencils library | Marketing - Design Elements ...
- Symbols In Plc
- Electrical Symbols — Electrical Circuits | Instruments - Vector ...
- Electrical Symbols — Composite Assemblies | Instruments - Vector ...
- Electrical Symbols , Electrical Diagram Symbols | Electrical Symbols ...








-instruments---vector-stencils-library.png--diagram-flowchart-example.png)
-instruments---vector-stencils-library.png--diagram-flowchart-example.png)
























-instruments---vector-stencils-library.png--diagram-flowchart-example.png)
-instruments---vector-stencils-library.png--diagram-flowchart-example.png)

-instruments---vector-stencils-library.png--diagram-flowchart-example.png)



-instruments---vector-stencils-library.png--diagram-flowchart-example.png)
-instruments---vector-stencils-library.png--diagram-flowchart-example.png)




,-pneumatic-fluid-power-equipment---vector-stencils-library.png--diagram-flowchart-example.png)
,-hydraulic-fluid-power-equipment---vector-stencils-library.png--diagram-flowchart-example.png)
















































-fluid-power-equipment---vector-stencils-library.png--diagram-flowchart-example.png)
-fluid-power-equipment---vector-stencils-library.png--diagram-flowchart-example.png)
-fluid-power-equipment---vector-stencils-library.png--diagram-flowchart-example.png)
-fluid-power-equipment---vector-stencils-library.png--diagram-flowchart-example.png)




-cloud-clipart---vector-stencils-library.png--diagram-flowchart-example.png)
-cloud-clipart---vector-stencils-library.png--diagram-flowchart-example.png)


-cloud-clipart---vector-stencils-library.png--diagram-flowchart-example.png)


-cloud-clipart---vector-stencils-library.png--diagram-flowchart-example.png)
-cloud-clipart---vector-stencils-library.png--diagram-flowchart-example.png)


