 Quality
This solution extends ConceptDraw PRO v9 and ConceptDraw MINDMAP v7 with Quality Management Diagrams (Total Quality Management Diagrams, Timelines, Workflows, Value Stream Maps) and Mind Maps (Presentations, Meeting Agendas, Problem to be solved).
HelpDesk
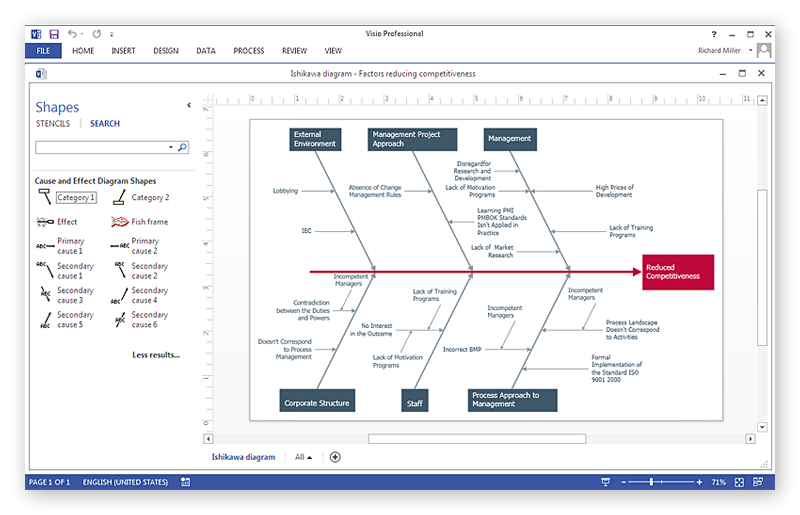
How To Create a MS Visio Cause and Effect Diagram Using ConceptDraw PRO
Cause-and-Effect Ishikawa Diagram is a graphical method of analysis and cause-effect relationships, a tool in the form of fish bone. It is used to systematically determine the cause of the problem and represent it graphically. The technique is primarily used in the framework of quality management for the analysis of quality problems and their causes. Nowadays, it has found worldwide distribution and is used in multiple problem areas. It is one of the tools of lean manufacturing, which is used in group work to find the problems and their causes. ConceptDraw PRO allows you to easily create Fishbone (Ishikawa) diagram and then make a MS Visio VSDX, or VSD files from your diagrams in a couple clicks, using the export capabilities of ConcewptDraw PRO.
 Project Exchange
This solution extends ConceptDraw PROJECT and ConceptDraw MINDMAP software with the ability to import and export project data.
HelpDesk
How to Track Your Project Plan vs. the Actual Project Condition
Conceptdraw PROJECT provides user with the possibility to track how the project is going. Project Manager can compare the actual data with the planned and assess possible measures to resolve issues. Conceptdraw PROJECT has several types of visual reports that can help to assess visually the difference between planned and actual project data.Product Overview
ConceptDraw PROJECT is a vigorous tool for managing single or multiple projects. It lets you determine all essential elements involved into project, control schedules, resources and finances, and monitor projects' progress in most effective yet simple manner.Gantt charts for planning and scheduling projects
ConceptDraw PROJECT is an excellent simple project scheduling software. It maintain classic project gantt charts and the line of professional reports on resources usage. It include handy critical path scheduling software tools and diagraming tools which helps prepare the presentation of project status. It include project tracking dashboard to keep project metrics upto date, also it have handy feature to export project management dashboard in excel file.
 PM Presentations
This solution extends ConceptDraw MINDMAP and ConceptDraw PRO software, improving the efficiency of the project management process by using the same source data to build targeted presentations.
 AWS Architecture Diagrams
AWS Architecture Diagrams with powerful drawing tools and numerous predesigned Amazon icons and AWS simple icons is the best for creation the AWS Architecture Diagrams, describing the use of Amazon Web Services or Amazon Cloud Services, their application for development and implementation the systems running on the AWS infrastructure. The multifarious samples give you the good understanding of AWS platform, its structure, services, resources and features, wide opportunities, advantages and benefits from their use; solution’s templates are essential and helpful when designing, description and implementing the AWS infrastructure based systems. Use them in technical documentation, advertising and marketing materials, in specifications, presentation slides, whitepapers, datasheets, posters, etc.
 Seating Plans
The correct and convenient arrangement of tables, chairs and other furniture in auditoriums, theaters, cinemas, banquet halls, restaurants, and many other premises and buildings which accommodate large quantity of people, has great value and in many cases requires drawing detailed plans. The Seating Plans Solution is specially developed for their easy construction.
- Timeline diagram | How to Create a Timeline Diagram in ...
- How to Create a Timeline Diagram in ConceptDraw PRO | Project ...
- How to Identify Project Milestones | How to Create a Timeline ...
- How to Create a Timeline Diagram in ConceptDraw PRO | How to ...
- Timeline Diagrams | How to Create a Timeline Diagram in ...
- How to Create a Timeline Diagram in ConceptDraw PRO | Project ...
- How to Create a Timeline Diagram in ConceptDraw PRO | Timeline ...
- How to Create a Timeline Diagram in ConceptDraw PRO | Timeline ...
- Gant Chart in Project Management | How to Create a Timeline ...
- Process Flowchart | How to Create a Timeline Diagram in ...
- Cross-Functional Flowchart | How to Create a Timeline Diagram in ...
- How to Report Task's Execution with Gantt Chart | How to Create a ...
- Timeline Diagrams | Timeline Diagrams | How to Create a Gantt ...
- Timeline Diagrams | Project timeline diagram - New business project ...
- Timeline Diagrams | How to Make a Timeline | Project Timeline ...
- Project Timeline | How to Make a Timeline | Timeline Diagrams ...
- How to Make a Timeline | Project Timeline | Timeline Examples ...
- How to Shift Dates in ConceptDraw PROJECT | Project Timeline ...
- How to Create a Gantt Chart for Your Project | Gant Chart in Project ...
- How to Identify Project Milestones | How to Report on Project ...


