HelpDesk
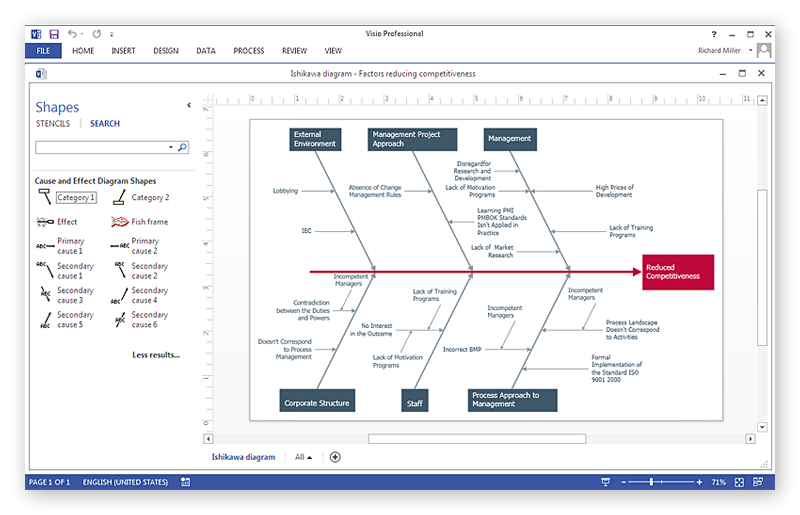
How To Create a MS Visio Cause and Effect Diagram Using ConceptDraw PRO
Cause-and-Effect Ishikawa Diagram is a graphical method of analysis and cause-effect relationships, a tool in the form of fish bone. It is used to systematically determine the cause of the problem and represent it graphically. The technique is primarily used in the framework of quality management for the analysis of quality problems and their causes. Nowadays, it has found worldwide distribution and is used in multiple problem areas. It is one of the tools of lean manufacturing, which is used in group work to find the problems and their causes. ConceptDraw PRO allows you to easily create Fishbone (Ishikawa) diagram and then make a MS Visio VSDX, or VSD files from your diagrams in a couple clicks, using the export capabilities of ConcewptDraw PRO.ConceptDraw PRO Database Modeling Software
ConceptDraw PRO is a very easy-to-use and intuitive database design tool which can save you hundreds of work hours. See database diagram samples created with ConceptDraw PRO database modeling database diagram software.HelpDesk
How To Create a PERT Chart
Project Evaluation and Review Technique (PERT) is a method of project tasks evaluation and analysis. PERT - is a method of analyzing the tasks required to complete the project. It includes analysis of the time required to complete each task, as well as the determination of the time required to carry out the whole project. PERT was developed to facilitate the planning of huge and complex projects. PERT is used for very large, complex, and non-standard projects. Technology implies the presence of uncertainty, making it possible to develop a schedule of the project without a precise information on details and time required for all of its components. The most popular part of PERT is a method of the critical path, based on the construction of the network schedule (PERT network diagram). ConceptDraw Office delivers you the best way to create PERT chart for your project using compatibility between ConceptDraw PROJECT and ConceptDraw PRO.HelpDesk
How to Generate ConceptDraw PROJECT Standard Reports on PC
The reporting capabilities of ConceptDraw PROJECT are really impressive. This section will help you find out what useful information can be obtained when using ConceptDraw PROJECT standard reports.- Best Flowchart Software | Create Flow Chart on Mac | Process ...
- Create Flowchart | Basic Flowchart Symbols and Meaning | How To ...
- Basic Flowchart Symbols and Meaning | Types of Flowcharts | How ...
- Flow Chart To Generate Cab Invoice
- Process Flowchart | How to Generate ConceptDraw PROJECT ...
- Flowchart Online Generator
- Accounting Flowcharts | How to Create Flowcharts for an Accounting ...
- Type Of Software Programs Used To Generate Functional Flow Charts
- How to Generate ConceptDraw PROJECT Standard Reports on PC ...
- Process Flowchart | How to Create Flowcharts for an Accounting ...
- Data Flow Diagrams | Create Flow Chart on Mac | ConceptDraw ...
- Euclidean algorithm - Flowchart | Basic Flowchart Symbols and ...
- How to Create a Social Media DFD Flowchart | How To Create a ...
- Process Flowchart | How to Create a Social Media DFD Flowchart ...
- Basic Flowchart Symbols and Meaning | Audit Flowchart Symbols ...
- Flowchart Marketing Process. Flowchart Examples | Sales Process ...
- Data Flow Diagram Symbols. DFD Library | Basic Flowchart ...
- Sales Process Flowchart . Flowchart Examples | Sales Process Steps ...
- Create Flow Chart on Mac | Cross-Functional Flowchart (Swim ...


