Basic Flowchart Symbols and Meaning


Types of Flowcharts


UML Class Diagram Generalization Example UML Diagrams

How To Create Onion Diagram

The vector stencils library "Plane geometry" contains 27 plane geometric figures.
Use these shapes to draw your geometrical diagrams and illustrations in the ConceptDraw PRO diagramming and vector drawing software extended with the Mathematics solution from the Science and Education area of ConceptDraw Solution Park.
Use these shapes to draw your geometrical diagrams and illustrations in the ConceptDraw PRO diagramming and vector drawing software extended with the Mathematics solution from the Science and Education area of ConceptDraw Solution Park.
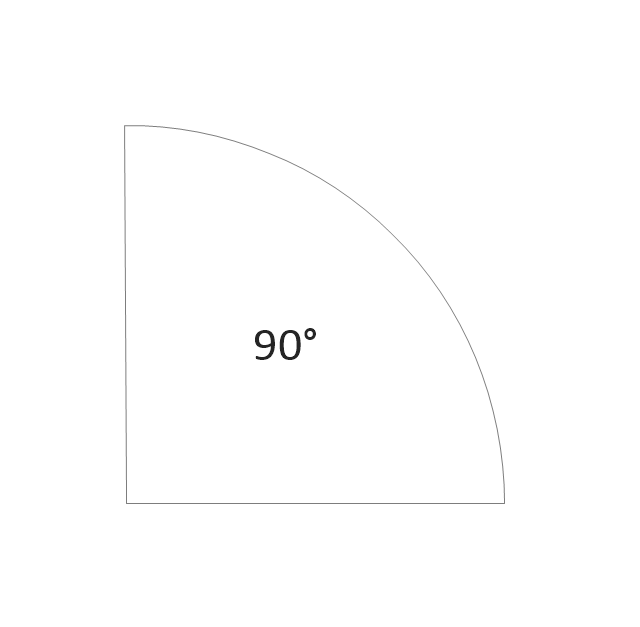
Circular sector
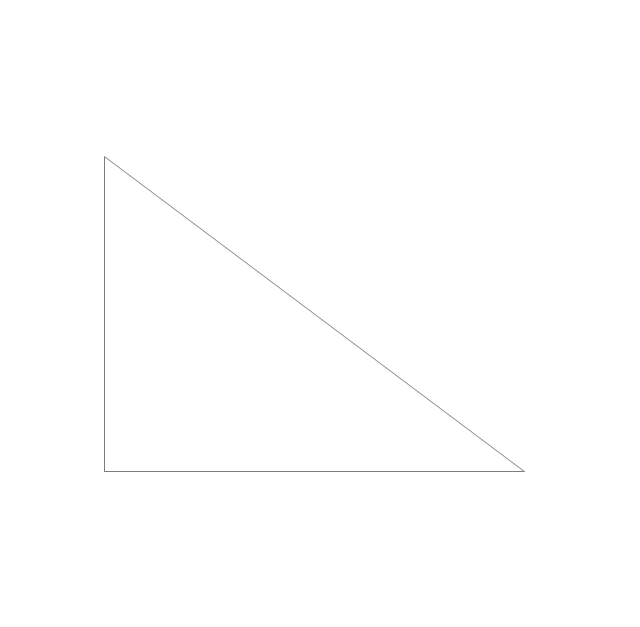
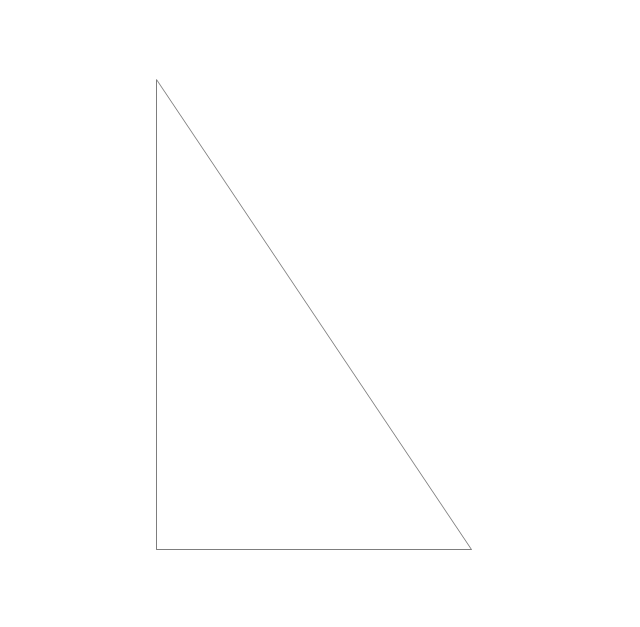
Right triangle
Rectangle

Square

Pentagon

Isosceles trapezium
Parallelogram
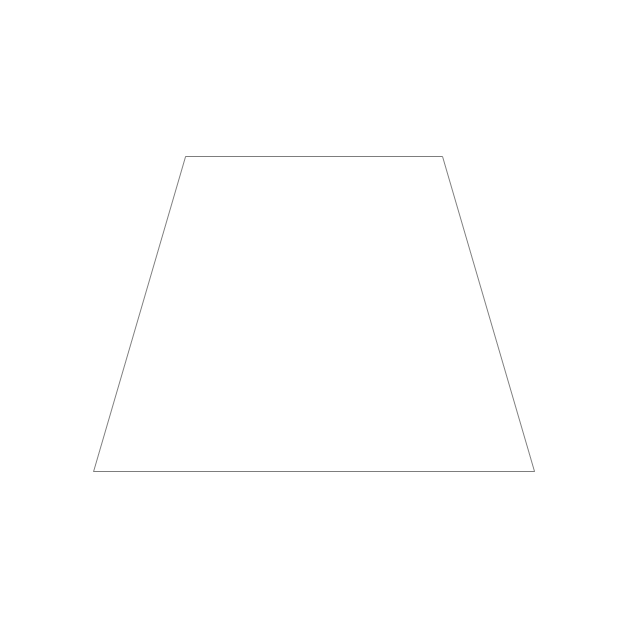
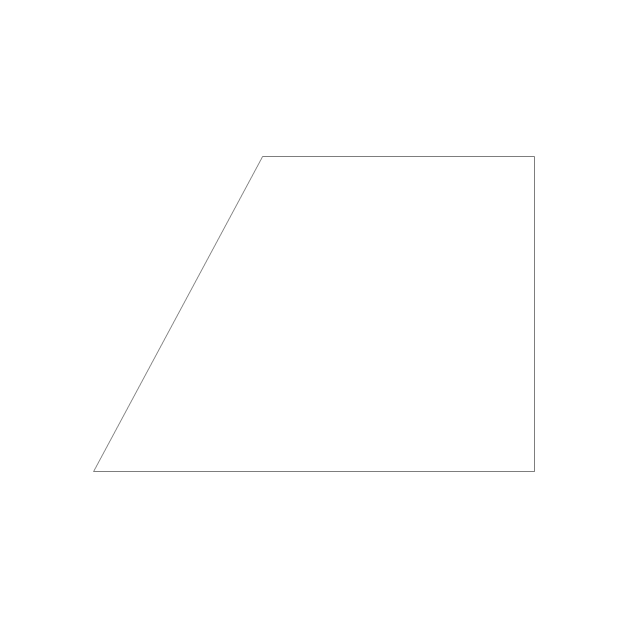
Trapezium
Three-pointed star

Four-pointed star

Five-pointed star

Six-pointed star

Seven-pointed star

Eight-pointed star

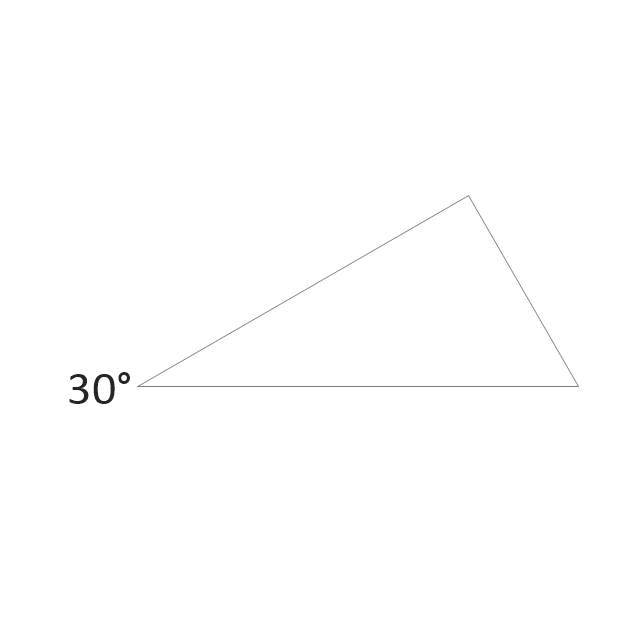
Triangle

Equilateral triangle

Right triangle 2
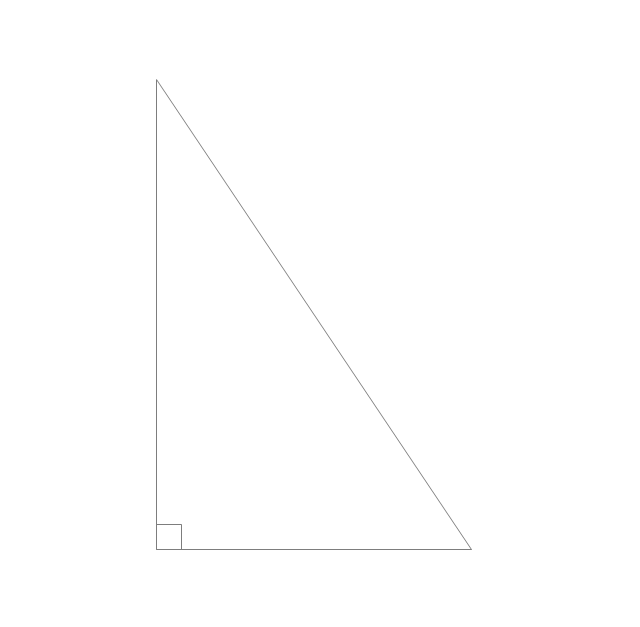
Right triangle, angle box
Right triangle 3
Hexagon

Regular hexagon

Regular pentagon

Regular heptagon

Regular octagon

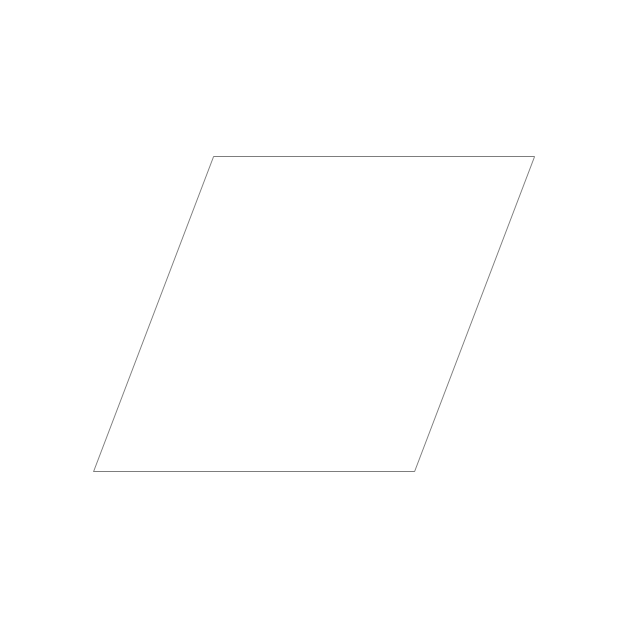
Rhombus

Circle

Ellipse

Create Response Charts

Flow Chart Online

Matrix Organization

Draw Fishbone Diagram on MAC Software

Business Board Org Chart

- Images Of All Geometrical Shapes And Figures
- Solid Shapes Images
- About Geometrical Shapes And Symbols Images In Computer
- Design elements - Solid geometry | How to Draw Geometric Shapes ...
- How to Draw Geometric Shapes in ConceptDraw PRO | Beautiful ...
- Good Geometrical Figures
- How to Draw Geometric Shapes in ConceptDraw PRO | Design ...
- Design elements - Solid geometry | Names Of Solid Figures Geometry
- Geometrical Chart Picture
- All Geometrical Figures Pdf Files