Basic Flowchart Symbols and Meaning
Flowchart Symbols and Meaning - Provides a visual representation of basic flowchart symbols and their proposed use in professional workflow diagram, standard process flow diagram and communicating the structure of a well-developed web site, as well as their correlation in developing on-line instructional projects. See flowchart's symbols by specifics of process flow diagram symbols and workflow diagram symbols.Cross-Functional Flowchart
Cross-Functional Flowchart - to draw cross functional process maps is by starting with a cross-functional flowchart samples and templates. Easy to draw sample cross functional Process Flow Diagrams. Using a Cross-Functional flowchart is a clear way of showing each team member’s responsibilities and how processes get shared or transferred between different teams and departments.Use cross-functional flowcharts to show the relationship between a business process and the functional units (such as departments) responsible for that process. To create it use the best flowchart maker of ConceptDraw PRO.
Campus Area Networks (CAN). Computer and Network Examples
A campus network provides wireless access to the Internet or LAN to users located in two or more buildings or in the open space surrounding those buildings. A campus network is usually set in the campus of a university, but the same kind of planning and design can be applied for other purposes. For example, the campus network can used for an office or industrial park, in a public place like a supermarket with an entertainment center, even on a farm. Another form of temporary campus network can exist during special events such as music festivals or rallies.The elementary campus networks arise spontaneously: the radio signals from the access points, which provide network inside the building are not limited to its walls, so any user in the backyard can also get wireless network access. The larger and more complex campus network may have additional access points in places specially chosen for serving clients, i.e., on the lawn in front of the college or in a coffee shop around the corner.
Process Flowchart
ConceptDraw is Professional business process mapping software for making process flow diagram, workflow diagram, general flowcharts and technical illustrations for business documents. It is includes rich examples, templates, process flowchart symbols. ConceptDraw flowchart maker allows you to easier create a process flowchart. Use a variety of drawing tools, smart connectors, flowchart symbols and shape libraries to create flowcharts of complex processes, process flow diagrams, procedures and information exchange.
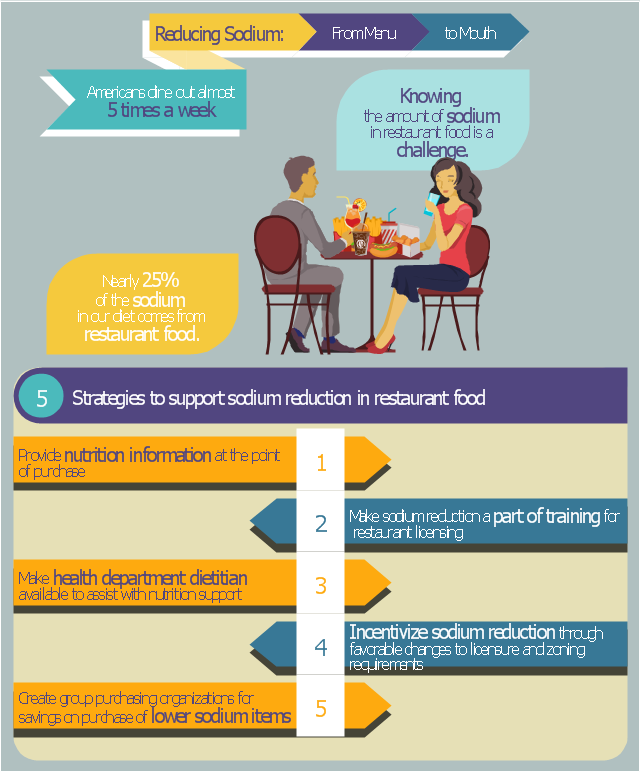
This human nutrition infographic example is redesigned from the Reducing Sodium: From Menu to Mouth Infographic on the Centers for Disease Control and Prevention (CDC) website.
"Infographics (Information Graphics) are visual representations of data, information or knowledge that tell a story through visual communication. ... infographics related to sodium and sodium reduction."
[cdc.gov/ salt/ sodium_ infographics.htm]
"The average American eats out at a fast food or dine-in restaurant almost five times a week. CDC is collaborating with the food industry to reduce sodium in the food supply and providing technical assistance to the public health community for work on sodium reduction, as it is a public health priority. CDC is offering strategies for how health departments and restaurants can work together for sodium reduction and to provide consumers with healthier choices in the report “From Menu to Mouth: Opportunities for Sodium Reduction in Restaurants,” published ... in CDC’s journal, Preventing Chronic Disease." [cdc.gov/ media/ dpk/ 2014/ dpk-sodium-content.html]
The diet infographics example "Food infogram - Reducing sodium" was drawn using the ConceptDraw PRO diagramming and vector drawing software extended with the Food Court solution from the Food and Beverages area of ConceptDraw Solution Park.
Collaboration in a Project Team
Create with our data flow diagram software perfect data flow diagrams. Download data flow diagram software for FREE. Use hundreds of data flow diagram examples.Local area network (LAN). Computer and Network Examples
A local area network (LAN) is a devices network that connect with each other in the scope of a home, school, laboratory, or office. Usually, a LAN comprise computers and peripheral devices linked to a local domain server. All network appliances can use a shared printers or disk storage. A local area network serve for many hundreds of users. Typically, LAN includes many wires and cables that demand a previously designed network diagram. They are used by IT professionals to visually document the LANs physical structure and arrangement.ConceptDraw - Perfect Network Diagramming Software with examples of LAN Diagrams. ConceptDraw Network Diagram is ideal for network engineers and network designers who need to draw Local Area Network diagrams.
Cross Functional Flowchart Symbols
The excellent possibility to create attractive Cross Functional Flowcharts for step-by-step visualization the operations of a business process flow of any degree of detailing is offered by ConceptDraw’s Cross-Functional Flowcharts solution. The extensive selection of commonly used vector cross functional flowchart symbols allow you to demonstrate the document flow in organization, to represent each team member’s responsibilities and how processes get shared or transferred between different teams and departments.Business Process Flow Diagram
Business Process Flow Diagram is a graphical presentation of business processes and process flows. It is one of the main tool of business analysis and business process re-engineering that lets identify and easy understand process flows within organization.ConceptDraw PRO extended with Business Process Workflow Diagrams solution from the Business Processes area of ConceptDraw Solution Park is a powerful software which lets easy design Business Process Flow Diagram of any complexity.
Ordering Process Flowchart. Flowchart Examples
A flowchart is a widely used type of diagram that visually represents an algorithm, workflow or process, using the boxes of various kinds to depict the steps and connecting them with arrows to show the order of execution these steps. Еhe ConceptDraw PRO supplied with Accounting Flowcharts Solution from the Finance and Accounting Area of ConceptDraw Solution Park is a powerful diagramming and vector drawing software which ideally suits for designing Ordering Process Flowchart of any complexity.- Level Diagram Of Safety Department
- How to Draw an Organization Chart | Marketing and Sales ...
- Floor Plans | Gym and Spa Area Plans | Design elements - Office ...
- Office Layout Plans
- Project — Working With Costs | Mind Map Making Software | How to ...
- Division Of Work Diagram
- Interior Design Office Layout Plan Design Element | Design ...
- Create Sophisticated Professional Diagrams - Simply ...
- Shipping And Receiving Workflow
- Draw The Organisation Structure Of Maintenance Department
- ERD | Entity Relationship Diagrams, ERD Software for Mac and Win
- Flowchart | Basic Flowchart Symbols and Meaning
- Flowchart | Flowchart Design - Symbols, Shapes, Stencils and Icons
- Flowchart | Flow Chart Symbols
- Electrical | Electrical Drawing - Wiring and Circuits Schematics
- Flowchart | Common Flowchart Symbols